LTV to CAC Ratio: What It Means and How to Improve It
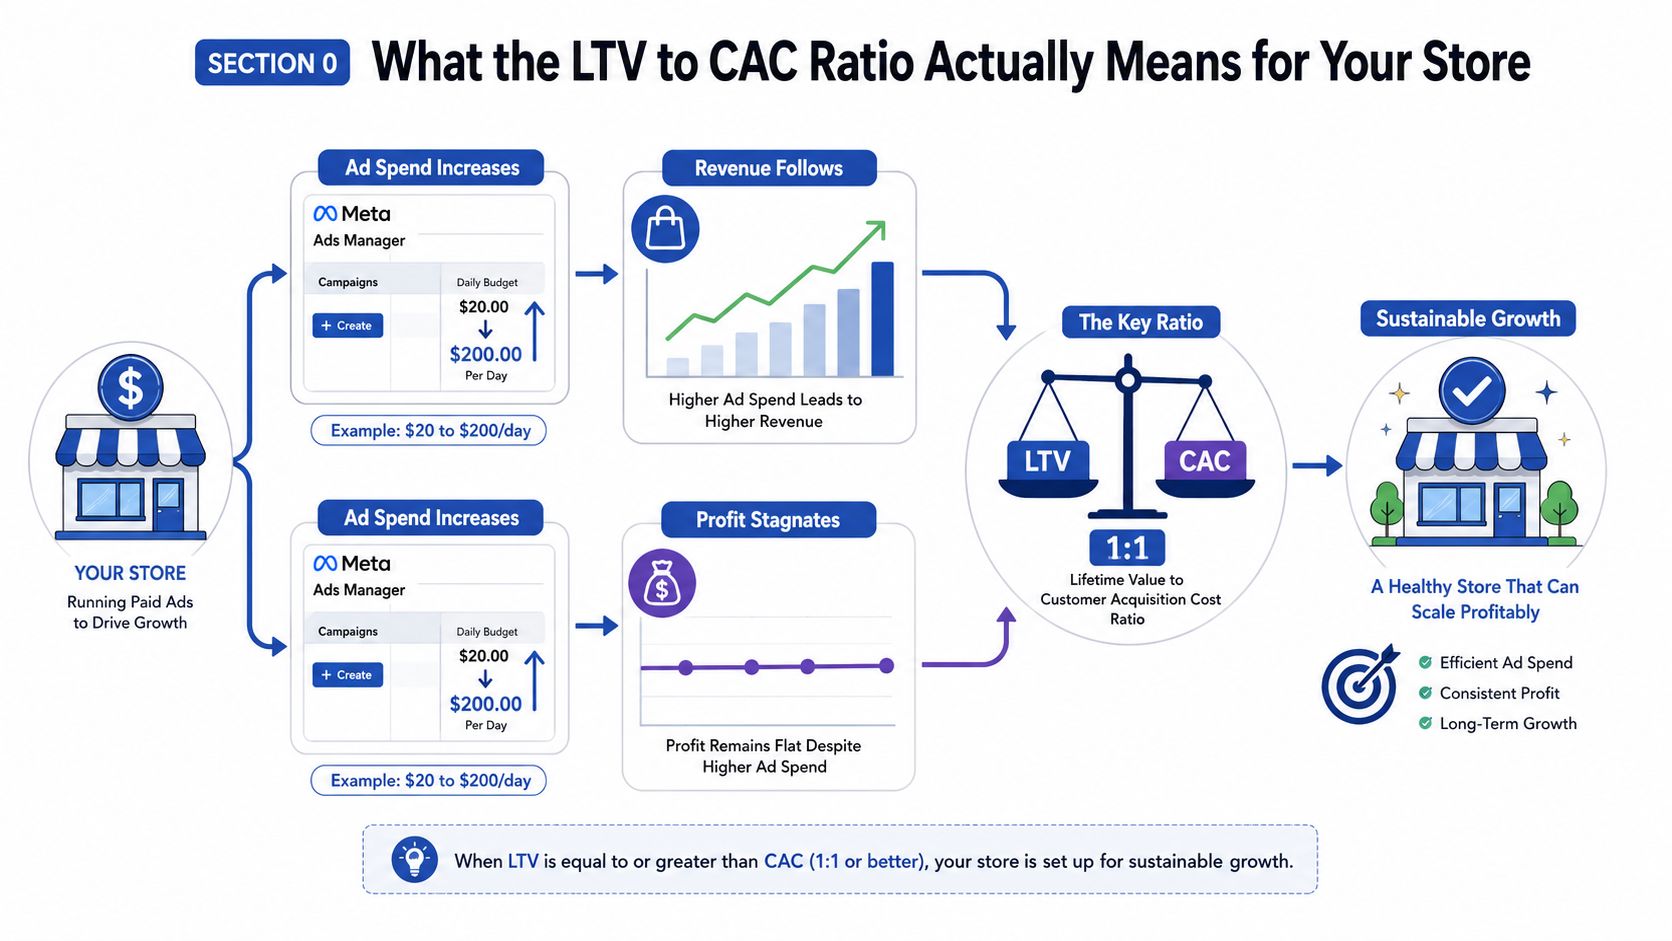
A store can watch Meta spend rise from $20 to $200 a day, see revenue follow, and still make no meaningful progress in profit. That's the trap the LTV to CAC ratio exposes. It shows whether each new apparel buyer is producing enough gross profit to justify the cost of acquiring them, or whether growing sales is draining cash.
For print on demand, the metric matters even more because customers often return months apart rather than weeks later. A 30-day ROAS snapshot can make a campaign look weak before repeat orders arrive, or look healthy while discounts, fulfillment costs, and creative expenses erase the margin. The right ratio gives you a clearer operating view, one that connects acquisition, retention, pricing, and contribution margin.
Table of Contents
- What the LTV to CAC Ratio Actually Means for Your Store
- The Formula Step by Step for Print on Demand
- Healthy Benchmarks POD Stores Should Target in 2026
- Why the 3 to 1 Myth Does Not Fit Every POD Brand
- Four Levers That Move Your Ratio Higher
- Two Real POD Store Examples and What Changed
- Your 90 Day Plan to a Healthier Ratio
What the LTV to CAC Ratio Actually Means for Your Store
Customer acquisition cost, or CAC, is the fully blended cost of bringing in a new buyer. For a POD store, that usually means ad spend plus the creative and promotional costs directly tied to acquisition, divided by the number of new customers acquired during the same period.
Customer lifetime value, or LTV, should reflect the gross profit a customer generates across every order, not just the revenue collected at checkout. If a buyer places an initial order and later returns for another tee, hoodie, or gift, the profit from those purchases belongs in the customer's lifetime value.
The basic formula is straightforward:
LTV:CAC = Customer lifetime value ÷ Customer acquisition cost
The ratio is a diagnostic, not a vanity score. A store with rising revenue but flat profit may have an acquisition problem, a margin problem, a retention problem, or a measurement problem. The ratio helps you identify which one deserves attention.
Why first-order ROAS can mislead POD operators
A 30-day ROAS view often favors the first transaction and ignores the buying rhythm of apparel customers. If your buyers purchase seasonally, return for new designs, or wait for a special drop, the first-order result doesn't capture the full economics of the customer.
That doesn't mean you should use projected repeat purchases to excuse an unprofitable funnel. It means your reporting needs two views: the cash result from the first order and the cohort-based profit that develops as customers return. Track both so you know whether you're funding growth responsibly while waiting for retention to prove itself.
Practical rule: Never calculate LTV from revenue alone. Use gross profit after product, fulfillment, transaction, discount, and acquisition-related costs that belong in the model.
Retention work should focus on the customer experience after delivery, not only the checkout. Resources such as how to keep customers coming back can help you think through repeat-purchase systems, while eCommerce analytics guidance can help organize the reporting needed to connect orders, customers, and channels.
The Formula Step by Step for Print on Demand
Start with average order value, or AOV. Divide total revenue by total orders for the period you're analyzing. In this apparel example, the store's average order value is $24.50.
Next, calculate gross profit per order. Subtract the blank garment cost, printing fee, shipping, and transaction fees from the selling price. The example lands at approximately $11.50 in gross profit per order.
Then estimate customer purchase frequency across a consistent period. If the average customer places 1.4 orders over 12 months, multiply gross profit per order by orders per customer:
$11.50 × 1.4 = $16.10 LTV
Now calculate blended CAC. Add Meta and TikTok advertising costs, UGC creator fees, and acquisition-related discount codes. Divide that total by net new customers, not total orders and not returning buyers. In this example, the resulting LTV:CAC ratio is approximately 1.8:1.
That number tells you the store is generating more customer value than acquisition cost, but it has limited room for overhead, testing, refunds, and reinvestment. Before changing campaigns, audit the inputs. POD operators commonly overstate LTV by using revenue instead of gross profit, then understate CAC by counting only media spend and ignoring creative production.
A working worksheet
| Metric | Calculation | Result |
|---|---|---|
| Average order value | Total revenue ÷ total orders | $24.50 |
| Gross profit per order | Selling price minus direct order costs | Approximately $11.50 |
| Orders per customer | Average orders over 12 months | 1.4 |
| Customer lifetime value | Gross profit per order × orders per customer | $16.10 |
| Blended CAC | Acquisition costs ÷ net new customers | Implied by the final ratio |
| LTV:CAC ratio | LTV ÷ CAC | Approximately 1.8:1 |
Keep the time window consistent
Use the same cohort and measurement period for both sides of the ratio. Comparing a current month's acquisition cost with a lifetime value estimate based on older, more mature customers can make performance look better than it is.
For a practical eCommerce model, review first-order contribution, repeat-purchase contribution, and blended cohort LTV separately. If you need a clearer way to interpret your Square CPA results, use the result as one input inside the broader CAC calculation rather than treating platform-reported CPA as your complete acquisition cost. Your average order value strategy also affects the ratio, because every improvement to profitable order value can flow through later purchases.
Healthy Benchmarks POD Stores Should Target in 2026
The most widely cited LTV:CAC benchmark is 3:1, meaning a business generates about $3 in customer lifetime value for every $1 spent acquiring that customer. Wall Street Prep's explanation of the LTV:CAC ratio describes this level as a commonly used minimum for a viable and sustainable model, while a ratio below 1:1 means acquisition is losing money and a ratio above 5:1 can suggest underinvestment in growth.
POD stores need to interpret those ranges through their own margin and repeat-purchase behavior. An apparel brand may have a lower purchase frequency than a subscription company, so a ratio that looks modest on paper can still support a sound cash-generating operation if the first-order margin is strong and acquisition payback is manageable.
Consider a sample apparel store generating $40,000 in monthly revenue with an $18 AOV. The revenue figure alone doesn't tell you whether the store can scale. You still need gross profit per order, blended acquisition expense, refund exposure, and the share of sales coming from returning customers.
Reading the ranges operationally
| Ratio Range | Meaning | Sample Outcome |
|---|---|---|
| Below 1:1 | Acquisition costs exceed customer gross profit | Growth drains cash before overhead |
| 1:1 to 2:1 | Acquisition is partly covered but leaves limited contribution | Little room for payroll, software, testing, or reinvestment |
| Around 3:1 | A commonly used sustainable target | More capacity for operations, creative testing, and profit |
| Above 5:1 | Strong economics or possible underinvestment | The store may be spending too cautiously and leaving demand untapped |
Benchmark data summarized by Capchase's SaaS and eCommerce benchmark analysis places the commonly healthy range around 2:1 to 4:1, while emphasizing that market and company stage matter. For POD, I'd treat 3:1 as a useful reference point, not an automatic pass or fail.
A ratio below 1:1 deserves immediate attention because each new buyer loses money before ordinary business overhead. A result between 1:1 and 2:1 may cover the acquisition event, yet leave too little contribution to fund growth. A result above 5:1 isn't automatically a victory either. It can mean your targeting is excellent, but it can also mean you've stopped testing channels, reduced spend too far, or measured CAC too narrowly.
Conversion rate is part of the context. Use eCommerce conversion rate benchmarks to investigate whether weak site performance is forcing your ads to carry too much of the acquisition burden.
Why the 3 to 1 Myth Does Not Fit Every POD Brand
A 3:1 ratio is useful because it gives operators a shared reference point. It becomes unhelpful when owners treat it as a universal requirement for every stage, margin profile, and growth objective.
Neutral benchmark coverage now recognizes material variation by stage. Harvard Business School Online's LTV:CAC discussion notes that early-stage businesses can operate below the classic benchmark, while scale-stage companies may need stronger economics. Current benchmark tables cited there show medians ranging from approximately 2.6x to 4.2x, depending on stage, with higher top-quartile results.
POD apparel also behaves differently from subscription software. Customers usually place fewer orders, and the business earns value through individual transactions rather than recurring billing. That makes first-order margin, product mix, creative efficiency, and reactivation especially important.
Set the target around the business you're actually running
| Brand Stage | Monthly Revenue | Target LTV:CAC | Why This Range |
|---|---|---|---|
| Early-stage learning store | Under $10,000 | Around 1.5:1 can be workable | The operator is buying data, creative feedback, and audience insight while improving the funnel |
| Mature POD brand | $50,000 or more | 3:1 to 4:1 | Stronger retention and operating discipline should create room for profit and reinvestment |
| Venture-style category leader | Growth-focused | 5:1 or higher may be reasonable | The brand may prioritize aggressive expansion, premium positioning, or dominance in a niche |
These are editorial operating targets, not universal laws. An early store with a 1.5:1 ratio may be making a rational investment if the operator has enough cash, is improving conversion and retention, and knows exactly what the spend is teaching. A mature brand with the same ratio likely has a more urgent problem because it should have better creative data, audience clarity, and repeat-purchase history.
The opposite mistake is assuming a high ratio always means the store is healthy. MetricStack's technical benchmark discussion describes 3:1 as the widely cited technical benchmark and frames results below 1:1, between 1:1 and 2:1, and at 4:1 or higher as distinct operating signals. For a POD operator, the useful question is not “Did I hit 3:1?” It's “Can this ratio support my current cash needs, payback expectations, retention profile, and growth ambition?”
Four Levers That Move Your Ratio Higher
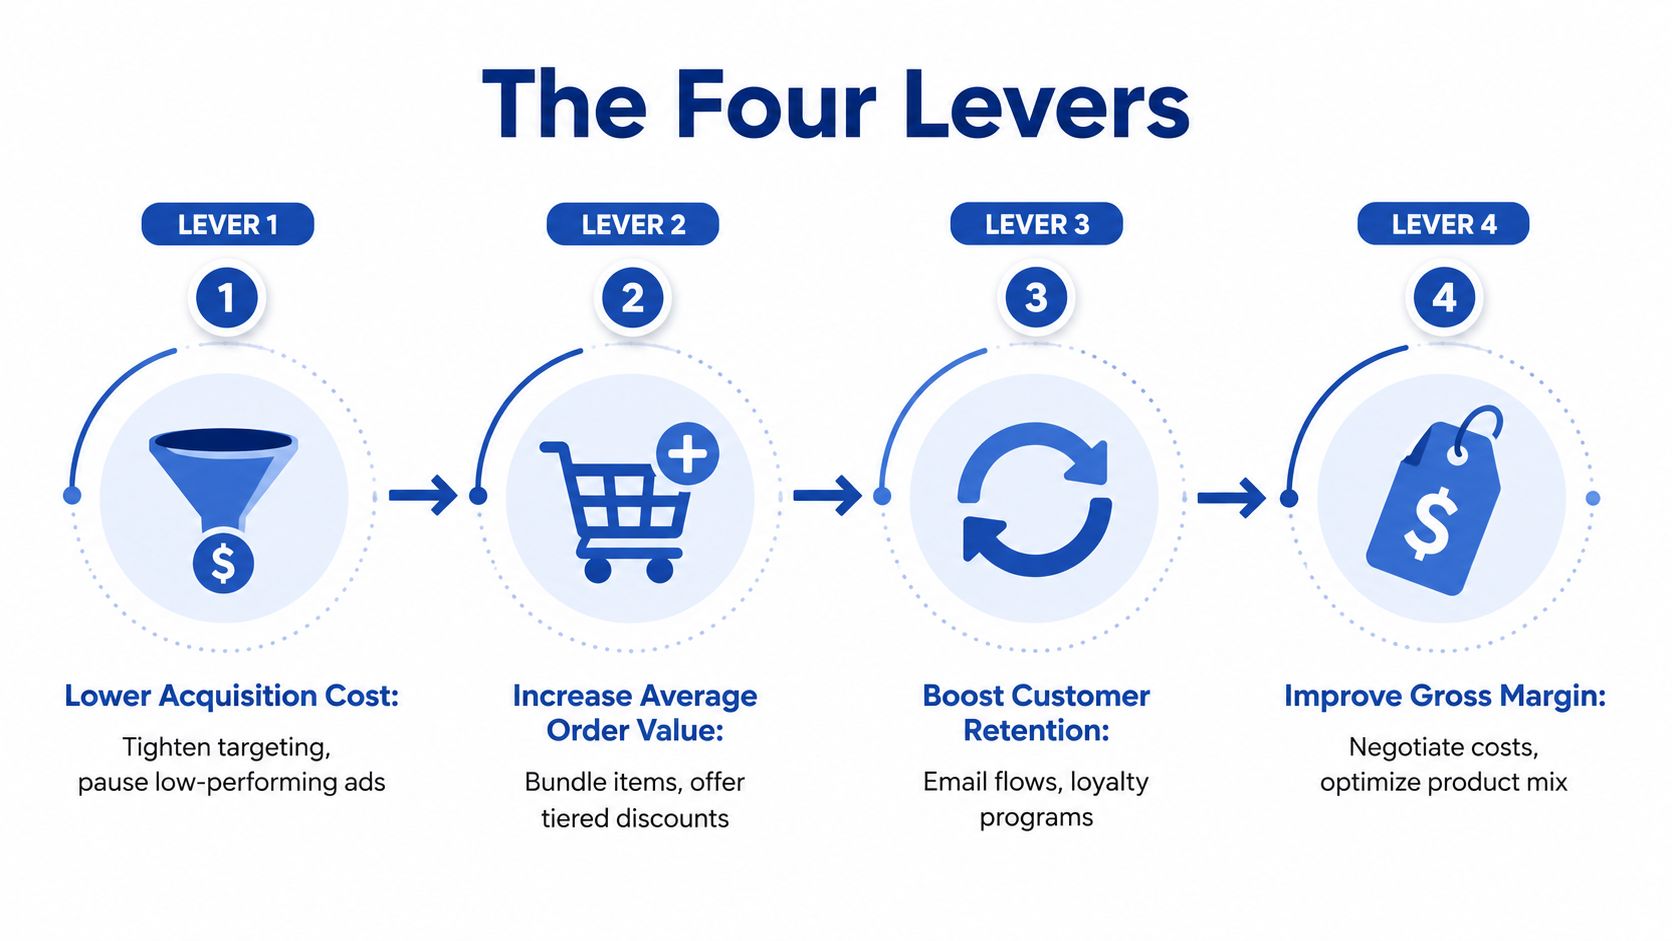
You can improve the ratio by lowering CAC, increasing profitable customer value, or doing both. In active apparel stores, the biggest gains usually come from working several levers together instead of obsessing over one ad dashboard number.
Lower acquisition cost without starving the funnel
Start by cutting waste, not by shutting off every campaign that hasn't paid back immediately. Tighten targeting, remove weak interest ad sets, and compare creator-led content with traditional product ads. The plan example uses creator content converting at 4% to 5% versus 1.5% for traditional ads, with CAC moving from $18 to $9. Those figures are scenario inputs, not universal outcomes, so validate them against your own account.
Creative costs belong in CAC. A low platform CPA can be misleading if the store is paying for repeated UGC production, editing, discount codes, and testing outside the ad account.
Increase repeat purchasing
Retention often produces cleaner economics than chasing colder traffic. A post-purchase email flow can educate the buyer about care, introduce complementary products, and make the next purchase feel timely rather than forced. Loyalty points and limited releases can give previous buyers a reason to return.
The supplied scenario models a 10% lift in repeat purchase rate adding roughly $7 to LTV on a store with a $45 AOV. Use that as a planning example, then replace it with your own cohort data.
Raise order value with a stronger offer
Bundles, complementary products, and premium blank upgrades can increase AOV without requiring another customer acquisition event. A $4 AOV increase raises LTV by the same $4 across every repeat order in the scenario, provided the added revenue doesn't create an equal or larger cost increase.
The offer has to remain easy to understand. A simple bundle with a clear saving usually beats a crowded collection of competing discounts.
Protect every dollar of margin
Negotiate blank costs, review print-provider tiers, and remove products that generate sales but little contribution. The example models an 8% lower blank cost and a margin improvement from 42% to 50%. Those are scenario figures for understanding the direction of the math, not promises about what any store will achieve.
Operator's view: A small margin improvement repeats every time the customer orders. A small CAC improvement helps every new customer. Fix both, then let retention multiply the effect.
The four levers can chain together. A store starting at 2:1 and improving acquisition efficiency, repeat purchasing, AOV, and gross margin could model a path toward 4:1 within two quarters, but that outcome depends on the store's baseline, measurement quality, and execution. Build the model before making the spend decision, then test one meaningful change at a time so you know what moved the result.
Two Real POD Store Examples and What Changed
The following operating scenarios show how different stores can improve the same ratio through different constraints. Store A has an acquisition problem and weak retention. Store B already has strong economics but needs more margin and better budget allocation.
Store A is a niche pet apparel brand producing $12,000 in monthly revenue, with a $22 CAC, $38 AOV, and a 1.6:1 ratio. The store was acquiring buyers, but the economics were slowly draining cash because the initial order didn't leave enough room for acquisition and overhead.
Store A rebuilt the customer journey
The operator made three changes over 90 days:
- Creative: UGC dog videos reduced CAC from $22 to $11 in the scenario.
- Retention: A post-purchase flow lifted repeat rate from 14% to 23%.
- Margin: A premium hoodie tier increased gross margin by 7 percentage points.
The modeled result was a 3.4:1 ratio. The important lesson isn't the final number by itself. The store used acquisition creative to reduce the denominator, retention to increase customer value, and product mix to improve the profit available from each order.
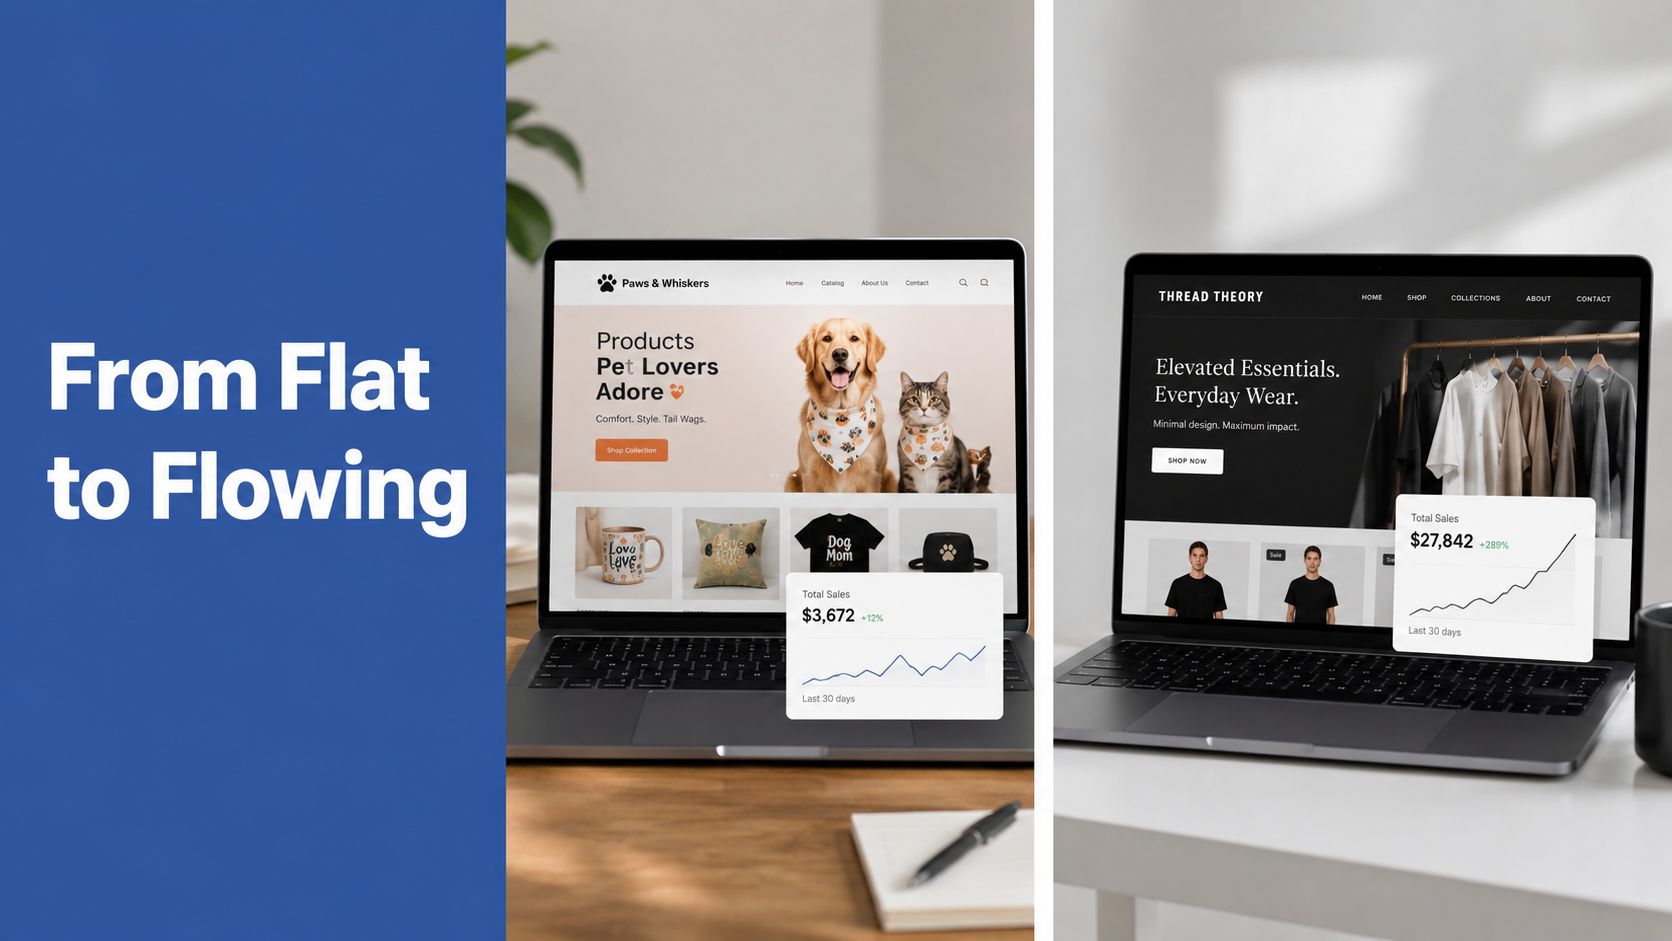
Store B is a graphic tee brand at $80,000 in monthly revenue with a 4.2:1 ratio, but rising CPMs were pushing CAC upward. Instead of assuming the ratio would remain stable, the operator improved the cost structure and shifted spend toward customers already familiar with the brand.
The changes included a 12% volume discount from the printer, a subscription-style mystery drop for repeat buyers, and moving 30% of the budget into retargeting, which converted at 8% in the scenario. The modeled ratio reached 5.8:1.
For broader context on how growth operators present outcomes, review Sup Growth client results, then apply the same discipline to your own store: identify the bottleneck, choose the matching lever, and measure the cohort rather than celebrating a short-term dashboard spike.
Your 90 Day Plan to a Healthier Ratio
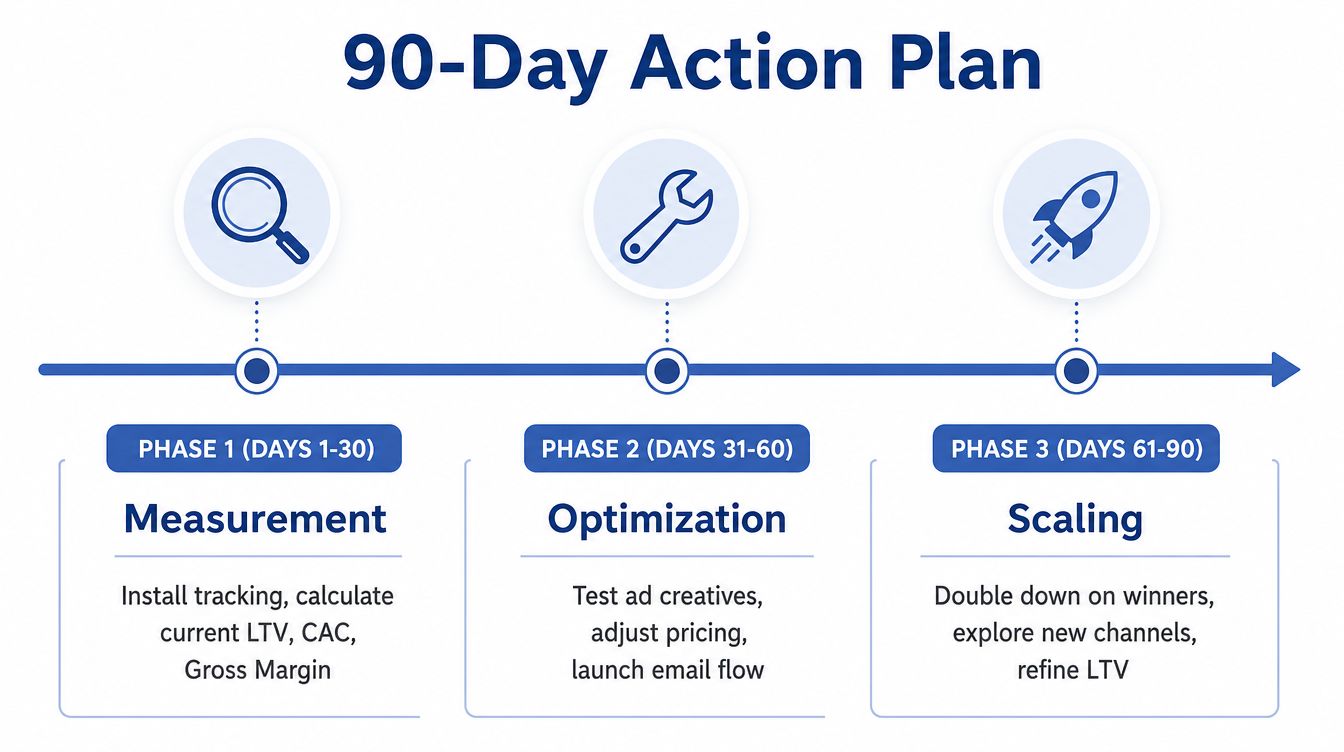
A healthier ratio comes from a sequence of decisions, not a single campaign adjustment. Use the first month to make the number trustworthy, the second to improve the cheapest inputs, and the third to scale what earns the right to receive more budget.
Days 1 to 30 focus on measurement
Install dependable order and customer tracking. Calculate current AOV, gross profit per order, blended CAC, repeat purchase rate, and cohort LTV. Separate new-customer performance from returning-customer revenue so organic demand doesn't make paid acquisition look more efficient than it is.
Use 3:1 as a reference benchmark, not a commandment. Compare it with your cash position, product margins, purchase cadence, and growth stage.
Days 31 to 60 target inexpensive improvements
Tighten ad targeting and pause campaigns that attract low-value buyers. Launch a post-purchase email sequence, test a $5 to $7 bundle upsell, and negotiate supplier or print-provider pricing. A modest 2 to 3 percentage point margin lift can matter when it applies across every order.
Don't change every variable at once. Choose one acquisition test, one retention test, one offer test, and one cost review. Record the result by cohort.
Days 61 to 90 build compounding demand
Add a loyalty program, create limited drops for past buyers, and test a referral incentive that rewards existing customers without destroying margin. Reallocate budget only after the underlying contribution data supports the decision.
Print on demand remains an accessible path to building a high-margin online business because you can test products without carrying traditional inventory risk. The opportunity becomes more exciting when you treat the store like an operator, measure the full customer relationship, and improve the levers that compound.
Skup helps POD entrepreneurs build and scale apparel stores with practical systems for product research, acquisition, retention, and profitability. Visit Skup to explore the Apparel Cloning System, coaching support, and AvatarIQ for faster design and mockup production.