Repeat Purchase Rate: The Metric That Predicts eCom Growth
A 28.2% average repeat purchase rate is a useful reality check for ecommerce operators. Roughly 28 out of every 100 customers return to buy again, according to a 2026 repeat purchase rate benchmark. For a print-on-demand apparel store, that second order often matters more than another burst of cold traffic because it reveals whether the first sale created enough value, trust, and brand affinity to bring the buyer back.
POD owners who watch only revenue and front-end return on ad spend can miss the story. A store can acquire customers profitably on the first order and still struggle to compound if those buyers never return. The operators who build durable growth treat repeat purchase rate as a Monday-morning operating metric, then connect it to products, post-purchase communication, customer identification, and acquisition decisions.
Table of Contents
- Why Repeat Purchase Rate Is the Hidden Growth Lever for POD Stores
- What Repeat Purchase Rate Actually Means
- 2026 Benchmarks Every POD Owner Should Know
- Calculating Repeat Purchase Rate for a POD Store
- How Repeat Purchase Rate Drives Lifetime Value and Ad Efficiency
- Segmenting and Tracking Repeat Buyers the Right Way
- The POD Playbook for More Repeat Buyers
- Common Misreads and Your 30 Day Repeat Buyer Plan
Why Repeat Purchase Rate Is the Hidden Growth Lever for POD Stores
A first sale feels like proof that the store works. It proves that a customer saw the design, trusted the offer, completed checkout, and accepted the product well enough to buy. It doesn't yet prove that the business can grow efficiently.
That distinction matters in POD. A single graphic tee sale may contribute revenue without fully covering blended acquisition costs, payment fees, fulfillment, refunds, support, and creative testing. The second and third orders are where the original customer relationship starts doing more of the financial work. You paid to earn attention once. A returning customer gives the store another chance to earn revenue without requiring the same first-touch acquisition process.
The founders behind Skup have generated more than $50 million in combined POD sales across a decade in the space, and their operating perspective is straightforward. New customer acquisition creates the input. Retention determines whether that input compounds or disappears. Meta and TikTok can still introduce a brand to valuable buyers, but a store that depends entirely on fresh audiences has less room to absorb creative fatigue, auction pressure, and changing organic distribution.
Operator's rule: Don't ask only whether the first order was profitable. Ask whether the customer had a clear reason to place the next one.
Consider two apparel stores with similar first-order economics. One keeps launching new designs for the same niche, follows up after delivery, and makes the second purchase easy. The other sends a generic receipt, waits for the next ad click, and treats every customer like a stranger. Their acquisition dashboards may look similar for a while. Their customer lifetime value and ability to scale won't.
The rest of this guide turns that difference into a working system. You'll get the formula, apparel-specific benchmarks, cohort math, lifetime value implications, tracking fields, and a prioritized POD playbook. The trade-off is real: every hour spent improving the second-order loop is an hour not spent chasing another cold audience. In many stores, that trade-off is overdue.
What Repeat Purchase Rate Actually Means
Repeat purchase rate is the percentage of customers who make a second or later purchase within a defined measurement window. The window could be 90 days or 365 days, both of which are common industry measurement periods, as described in repeat purchase rate guidance. The time limit matters because apparel buyers don't necessarily reorder on the same schedule as grocery or personal-care shoppers.
The common formula is:
Repeat purchase rate = customers with 2 or more orders divided by total unique customers, multiplied by 100
A repeat buyer is a distinct customer who placed another valid order inside the selected window. A first-time customer placed one qualifying order and hasn't placed another within that same measurement rule. The numerator counts people, not orders. If one customer places three orders, that customer still contributes one repeat customer to the numerator.
Keep the definitions separate
Store dashboards often place related metrics beside one another, which creates avoidable confusion.
- Repeat purchase rate: The share of customers who bought at least twice in the defined window.
- Repeat customer rate: Often used as a count-based view of repeat buyers, but the exact denominator can vary by platform.
- Retention rate: A broader measure of whether a defined customer cohort remains active or returns over time. It can use different activity rules and checkpoints.
- Purchase frequency: The average number of orders per customer. It tells you how often customers buy, not what portion returned.
The most common mistake is comparing figures that use different denominators. One report might include every unique customer in a calendar period. Another might evaluate a cohort based on its first purchase date. A third might count orders instead of customers. Guidance on repeat purchase rate measurement definitions warns that these variations can make cross-brand comparisons misleading.
For POD apparel, use a window long enough to include the actual buying cycle. A short window can be useful as an early signal, but it won't tell the whole story for seasonal designs, occasional gifting, or customers who wait for a new collection.
If your measurement window is shorter than your average repurchase cycle, you're not measuring loyalty. You're measuring patience.
2026 Benchmarks Every POD Owner Should Know
Benchmarks only help when the buying behavior matches. Grocery customers reorder because products are consumed. Apparel customers return for a new design, stronger identity, better fit, reliable quality, or a collection that gives them another reason to buy. A POD store should not set targets from categories with a different purchase rhythm.
A widely cited 2026 ecommerce benchmark places DTC and ecommerce repeat purchase rates around 25% to 30%, with an average of 28.2% across a broader benchmark set, according to 2026 ecommerce repeat purchase statistics. A separate retail benchmark reports an overall average of 16.5%. Its figures include Apparel at 20.2%, Health and Beauty at 21.5%, and Sporting Goods and Outdoor at 21.2%, according to repeat purchase rate benchmarks by industry.
The figures differ because the populations, measurement windows, and definitions differ. Use category data for orientation, then compare equal-age cohorts from your own catalog. That comparison is more useful than chasing a broad ecommerce average.
| Category | Healthy RPR Range | POD Implication |
|---|---|---|
| DTC and ecommerce | 25% to 30% | A broad reference point, subject to the window and denominator |
| Apparel | Around 20% to 30% | A practical range for many POD stores with strong niche alignment |
| Health and Beauty | 21.5% in one retail benchmark | Replenishment can encourage more frequent returns |
| Sporting Goods and Outdoor | 21.2% in one retail benchmark | Affinity helps, but product cadence still varies |
| Grocery and food delivery | Up to 65.2% in one benchmark | Consumption makes this a poor direct apparel target |
| Luxury goods | Near 9.9% in one benchmark | Longer consideration and replacement cycles can lower the rate |
POD apparel often sits between replenishment categories and occasional-purchase goods. Customers do not consume shirts like food, yet a strong niche can create identity-driven demand. A dog-mom collection, occupation-based design, or community uniform may prompt another purchase even when the customer does not need another shirt.
Sub-20% performance is a reason to investigate, not an automatic failure. Review the store's niche, product mix, customer identification, and post-purchase timing before changing the target. The retail benchmark found that retailers with identification rates above 40% recorded repeat purchase rates 53% higher than average, while retailers below 10% recorded rates 33% lower than average. Weak customer matching can make a healthy store appear weaker than it is.
A store above 35% should examine what is producing that result. Compare dog-mom tees with minimalist streetwear, seasonal gifting with evergreen identity products, and bundles with single graphic tees. The useful target is the rate your specific catalog can sustain, not the highest figure in a general benchmark.
Calculating Repeat Purchase Rate for a POD Store
Start with a cohort, not a blended customer list. A useful definition is customers with 2 or more orders in a defined window divided by all customers who bought in that same window, as outlined in cohort-based repeat purchase rate guidance. For a POD store, I prefer an even clearer operational version: take customers whose first qualifying order occurred during the cohort period, then count how many placed another qualifying order before the checkpoint.
Suppose 1,000 customers place their first order in January. By March 31, 180 distinct customers have placed a second order. The calculation is:
180 divided by 1,000, multiplied by 100 = 18% repeat purchase rate
That result is meaningful only if the orders are valid. Exclude cancellations, refunded orders where the purchase didn't stand, internal test orders, and obvious fraud. A fulfilled-order view may be more useful for diagnosing product experience because it connects the repeat event to an order the customer received.
Count customers, not order volume
If the store has 1,500 total orders from 1,000 customers, you can't use 1,500 as the numerator. Some customers may have placed several orders, while others bought once. The numerator remains the number of distinct customers with another qualifying purchase.
You can report checkpoints separately:
- 30-day rate: Returning customers by day 30 divided by the first-order cohort.
- 60-day rate: Returning customers by day 60 divided by the same first-order cohort.
- 90-day rate: Returning customers by day 90 divided by the same first-order cohort.
A graphic-tee cohort may show a different return pattern from a niche bundle. Track both, but don't compare a younger cohort with an older one. Repeat purchase rate generally rises as customers have more time to reorder, so a January cohort measured at 90 days has more opportunity than a March cohort measured at 30 days.
| Cohort | Returning customers | Calculation | Repeat purchase rate |
|---|---|---|---|
| January first-order cohort by day 30 | Use distinct customers with a second valid order | Returning customers ÷ first-order cohort × 100 | Report the resulting percentage |
| January first-order cohort by day 60 | Use the same original cohort | Returning customers ÷ first-order cohort × 100 | Report the resulting percentage |
| January first-order cohort by day 90 | Use the same original cohort | Returning customers ÷ first-order cohort × 100 | Report the resulting percentage |
Keep a simple worksheet with five fields: measurement period, first-order cohort, returning customers, excluded cancellations or invalid orders, and resulting rate. Add product type and acquisition source so the number can guide a decision instead of decorating a dashboard.
How Repeat Purchase Rate Drives Lifetime Value and Ad Efficiency
Lifetime value becomes useful when it helps you decide what you can afford to do next. A practical starting model is average order value multiplied by expected orders per customer, followed by deductions for variable product, fulfillment, and returns costs. For a more detailed framework, use these actionable CLV formulas for founders and separate gross revenue from contribution margin.
Consider a store with a $55 average order value and 1.6 expected orders per customer. Its gross revenue model is $88 per customer before costs. If the first order produces $36 in contribution, the acquisition decision differs from a store expecting only 1.25 orders per customer, assuming the returning order is incremental and retains a healthy margin.
Repeat rate affects the number of customers who create those additional orders. If 1,000 new customers produce 180 second orders, the cohort's repeat purchase rate is 18%. At a 30% repeat purchase rate, the same-sized cohort produces 300 second orders, or 120 additional returning customers without acquiring another first-order customer, as shown by the repeat purchase rate benchmark framework.
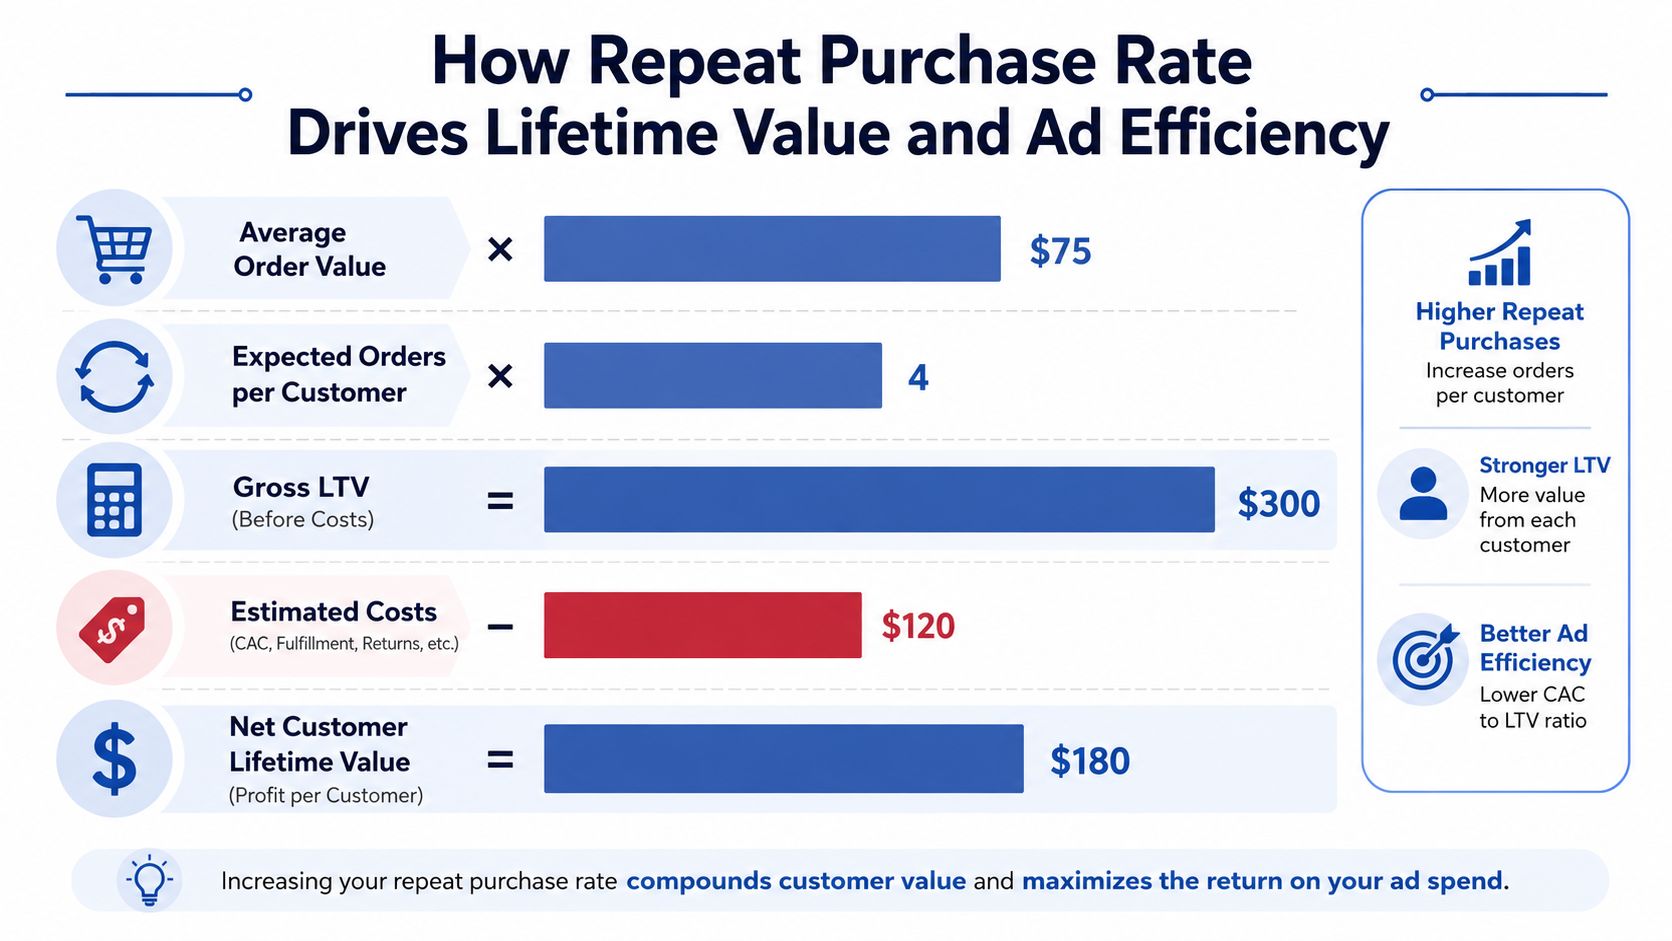
That doesn't mean you should automatically raise Facebook or other paid-social bids. A stronger repeat loop can support a higher allowable CAC only when contribution-margin payback stays inside your target period. Returning orders must be measured by cohort, and you shouldn't assume every second purchase would have happened because of the retention tactic.
Use the right LTV
Gross revenue LTV is easy to calculate and easy to misuse. Contribution-margin LTV accounts for the economics that remain after product cost, fulfillment, refunds, and other variable expenses. Use the second figure for budget decisions.
Repeat purchase rate also improves forecasting. It helps you estimate how much revenue may come from existing customers, plan design launches, evaluate inventory exposure for stocked items, and judge whether higher acquisition spend has a realistic payback path. For a practical view of the acquisition side, review Skup's guidance on reducing customer acquisition cost.
Avoid three accounting traps:
- Refund contamination: Count valid completed purchases, not orders that disappeared through cancellation or refund.
- Blended AOV distortion: New and returning customers may have different basket sizes, so report them separately.
- False incrementality: A repeat buyer may have returned naturally. Compare exposed and unexposed cohorts where possible before crediting a campaign.
Segmenting and Tracking Repeat Buyers the Right Way
A single store-wide rate tells you that something happened. Segmentation tells you where it happened. Start by grouping buyers according to the month of their first purchase, then measure the same cohort at 30, 60, and 90 days, with longer checkpoints for seasonal apparel.
The first layer is time. The second is product. Break out the first purchase by SKU, design, collection, print method, price band, and bundle status. A customer who buys a different design still counts as a repeat buyer, but the path between products can reveal which collection creates the strongest next-order behavior.
Resolve the customer identity
Guest checkout, alternate email addresses, device changes, and marketplace orders can split one person into multiple records. Use a stable customer ID when possible, deduplicate events, and define a repeat buyer as the same identified person or household with another valid order.
This is not busywork. The retail benchmark cited earlier connected stronger identification rates with stronger repeat behavior, so poor identity resolution can make a retention problem look worse than it is. It can also make a campaign look better by counting fragmented records inconsistently.
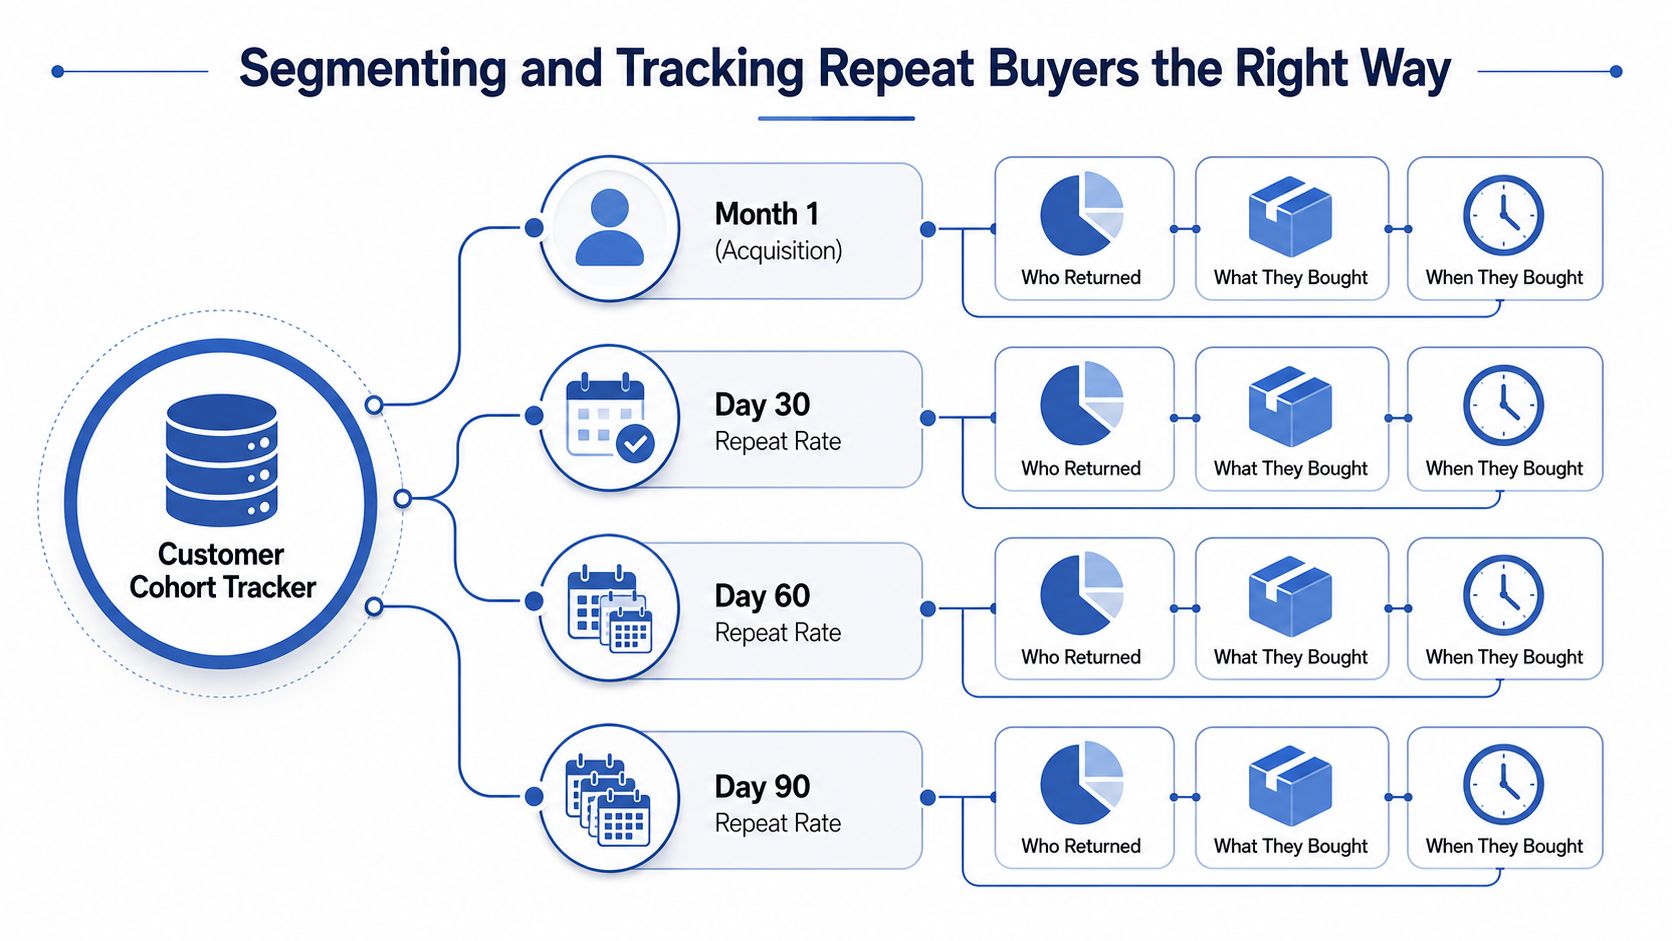
A useful dashboard needs more than one card. Build a cohort heatmap, a repeat-rate card by acquisition source, a product-affinity table, and a funnel from first order to second order to third order.
Track these fields:
- Customer timeline: First-order date, last-order date, and time to next order.
- Commercial behavior: Orders, net revenue, AOV, and discount dependency.
- Experience signals: Fulfillment issue, refund status, support contact, and product category.
- Acquisition context: Source, campaign, creative, and landing-page path.
Shopify or another ecommerce platform is usually the order source of truth. Your analytics system can add behavioral context, the email platform can show engagement and flow revenue, and ad platforms can show attributed conversions. Those systems may report different denominators, so don't merge their percentages without documenting the rules. Skup's customer segmentation examples are useful when deciding which customer groups deserve separate treatment.
Review the dashboard weekly, but compare only segments with the same cohort age and attribution rules. A 90-day mature cohort and a 30-day recent cohort aren't competing performance reports.
The POD Playbook for More Repeat Buyers
The highest-return retention work usually starts after delivery, not with a complicated loyalty program. A buyer needs confirmation that the order is moving, reassurance that the product was worth buying, and a relevant reason to browse again.
Begin with a post-purchase email sequence:
- Shipping confirmation: Set expectations and reduce uncertainty.
- Delivery follow-up: Help the customer feel seen after the package arrives.
- Review request: Gather feedback and surface product issues.
- Cross-sell message: Present a related design or collection when the first product has had time to land.
Tailor browse and cart abandonment flows to apparel behavior instead of sending generic reminders. A buyer who viewed a niche collection shouldn't receive the same message as someone who already purchased a sweatshirt. Skup's new-customer onboarding guidance can help connect first-order communication with the next purchase opportunity.
Prioritize the work
| Tactic | Priority (1-5) | Expected RPR Lift | Effort | Time to Impact |
|---|---|---|---|---|
| Post-purchase email flow | 5 | Measure movement by cohort | Moderate | Early |
| Product and fulfillment improvement | 5 | Measure movement by affected SKU | Moderate to high | Depends on issue |
| Consistent design refreshes | 4 | Measure return behavior by collection | Moderate | After launches |
| Loyalty or referral structure | 3 | Measure member and non-member cohorts | Moderate | Gradual |
| AvatarIQ testing | 4 | Measure repeat behavior by design and audience | Moderate | After enough cohort age |
The product experience still carries the strategy. Fit consistency, print durability, accurate mockups, shipping communication, and unboxing all influence whether the customer trusts the next order. A loyalty program can't rescue a shirt that arrives different from the expectation.
Design refreshes give customers a reason to return. For a strong niche, build a release calendar that creates continuity without making the catalog feel random. A monthly graphic-tee club or seasonal curation can make sense when the audience wants ongoing identity products, while points can reward purchases, reviews, or referrals without training customers to wait for discounts.
Use AvatarIQ to test designs, mockups, and audience angles before expanding a collection. The point isn't to generate more listings for their own sake. It's to identify which creative combinations attract buyers who later show stronger repeat behavior.
Finally, review practical lessons from SelfServe on repeat sales, especially the emphasis on value beyond constant discounting. For every tactic, record the launch date, affected cohort, customer segment, and resulting repeat purchase rate at the same checkpoint. If the number doesn't move, keep the tactic only if it improves another meaningful part of the customer experience.
Common Misreads and Your 30 Day Repeat Buyer Plan
More cold traffic won't fix a broken second-purchase loop. It can increase the number of first orders while leaving blended CAC under pressure, especially when the store hasn't solved product expectations, delivery communication, or post-purchase relevance.
Repeat purchase rate also isn't interchangeable with customer retention rate. The metrics can use different cohorts, windows, and activity definitions. Measuring only a single 30-day window can hide seasonal apparel cycles and make a long-cycle store look weaker than it is.
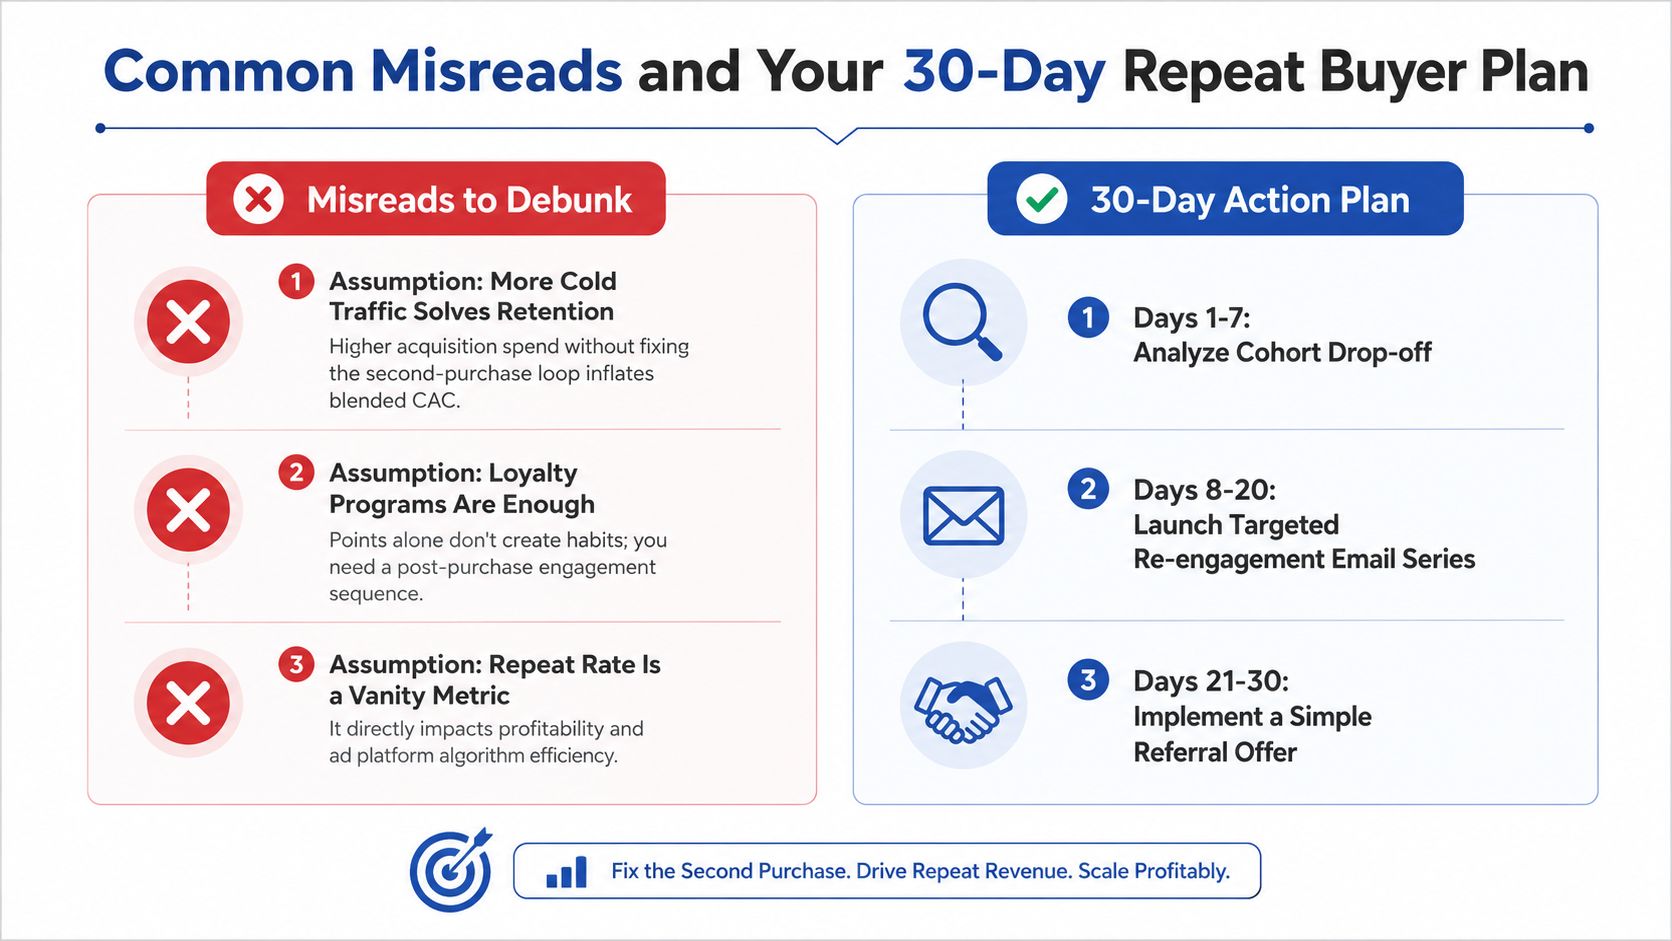
Use the next 30 days to build a cleaner operating rhythm:
- Week 1: Audit repeat purchase rate by equal-age cohort and locate the largest drop between first and second order.
- Week 2: Ship or rebuild the four core post-purchase emails, including delivery follow-up and review collection.
- Week 3: Create a design-drop calendar and launch a browse-abandonment flow tied to the viewed collection.
- Week 4: Set up the cohort dashboard, review the movement, and document which changes deserve another cycle.
The opportunity is encouraging because every improvement strengthens the same customer base you already worked to acquire. A higher repeat purchase rate can raise lifetime value, improve forecasting, and give your store more room to make disciplined acquisition decisions over the long run.
If you want to turn repeat purchase rate into a weekly growth system, visit Skup to explore its practical POD education and operator-led resources. Use the Apparel Cloning System to build a stronger design pipeline, then connect your customer data and creative testing with a retention plan that gives buyers a clear reason to return.