What Is Split Testing and How to Run Winning Tests
You've got a POD product page that attracts steady visitors, but sales seem to stop at the finish line. You start questioning everything: is the price too high, is the main mockup weak, or does the headline fail to explain why someone should care? Changing all three at once might feel productive, but it leaves you with no reliable way to know what helped.
That's where split testing gives you a calmer path forward. You compare controlled versions, measure real shopper behavior, and make the next store decision with evidence instead of opinion. For a POD business, that discipline can turn small improvements into an exciting, repeatable growth system.
Table of Contents
- What Split Testing Really Means for Your Store
- The Main Types of Split Tests You Can Run
- The Statistical Basics You Actually Need
- A Reusable Setup Template for POD Sellers
- Common Pitfalls That Quietly Ruin Results
- High-Impact Test Ideas Worth Running First
- Your Valid Test Checklist and What Comes Next
What Split Testing Really Means for Your Store
A shopper lands on your POD product page, views the shirt, and leaves without buying. You suspect the hero mockup, but changing the mockup, headline, and offer together would hide the reason for any improvement. A split test gives you a cleaner answer by comparing controlled versions of one store asset.
A split test, also called an A/B test, randomly assigns visitors to two versions. Some see the current version, called the control, while others see a variation. Both groups are measured against one defined goal, such as add-to-carts, completed checkouts, purchases, or revenue per visitor.
Suppose your page opens with a model wearing your shirt against a plain background. You want to learn whether a lifestyle mockup, showing the shirt in a real setting, helps shoppers picture the product. Keep the headline, price, description, shipping details, and checkout experience unchanged. The hero mockup becomes the only variable.
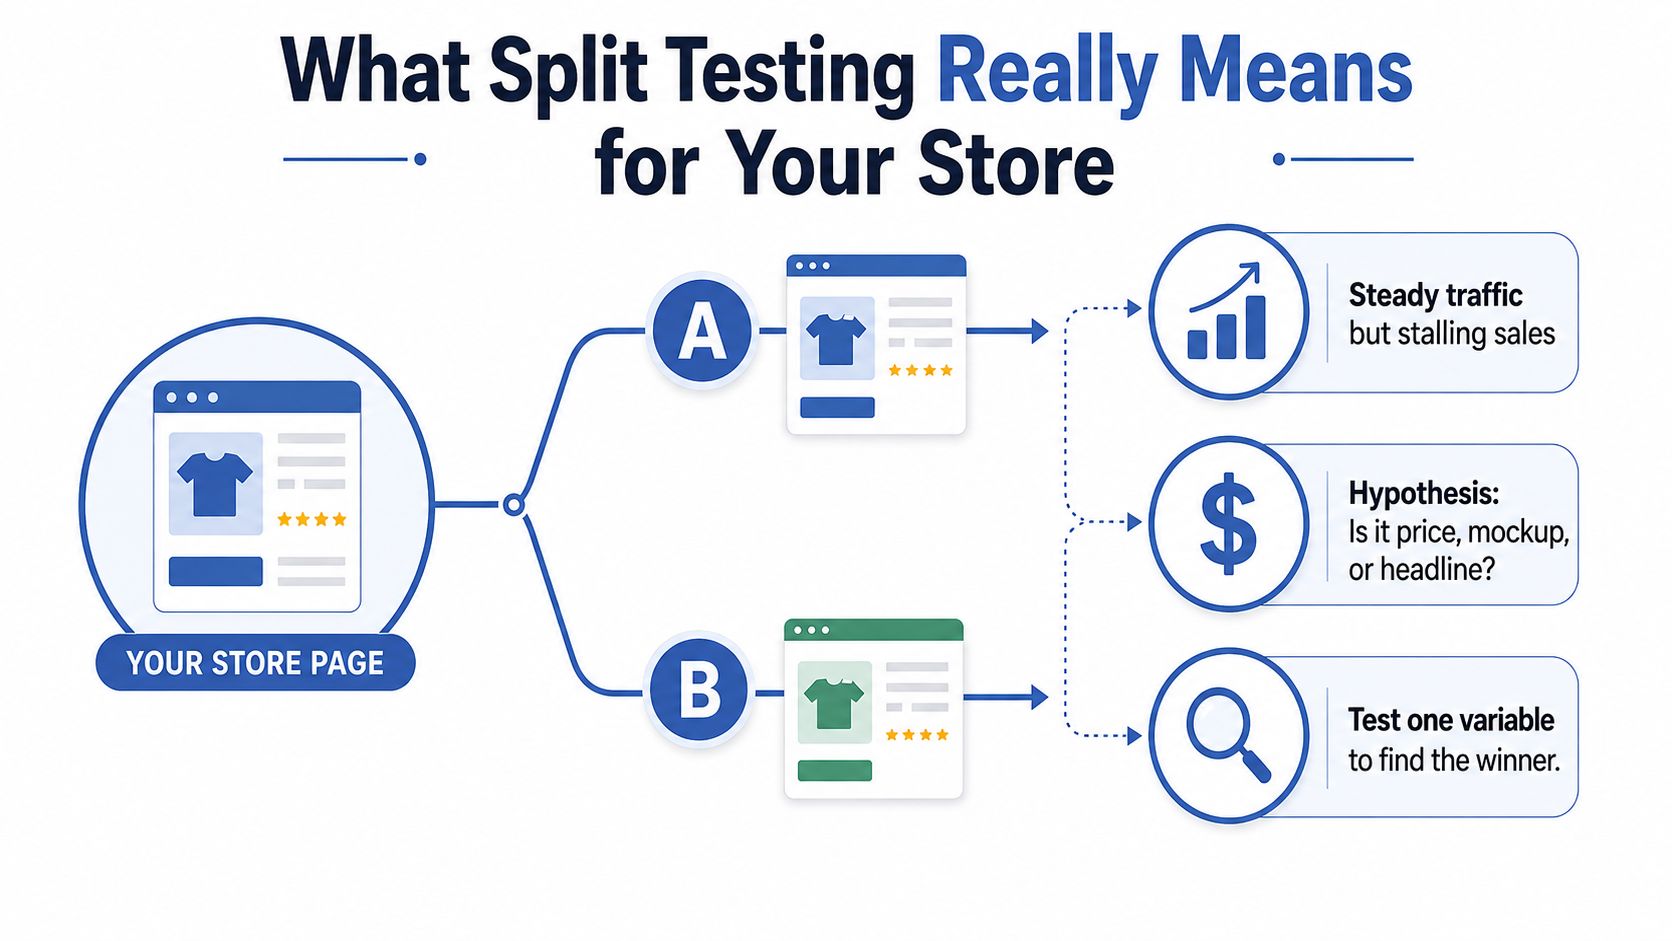
The question at the end is not, “Which mockup do I prefer?” It is, “Which version produced stronger shopper behavior under the same conditions?” Your taste can differ from a customer's response, so controlled comparison keeps personal preference from deciding the outcome.
Why POD stores benefit from controlled comparison
Print on demand sellers often work with limited traffic, focused product lines, and careful margins. Every visitor matters, and a small store cannot afford to spend weeks testing changes that are unlikely to affect buying behavior. Start with a page that already receives visits and a problem that could influence a purchase. Skip elaborate multivariate experiments until traffic can support them.
A test also gives an unfamiliar idea a fair trial. A headline may look less polished but explain the product more clearly. An offer may feel less exciting yet lead to more completed orders. The result helps you keep a useful change or reject one that only seemed promising.
For broader conversion principles, CRO strategies for HVAC and roofing companies provides a related guide to reducing friction across buying journeys. For store-specific ideas, see this practical guide on how to increase your eCommerce conversion rate.
Practical rule: A split test should answer one business question, not settle every question on the page.
A 2026 analysis of 1,001 A/B tests found that 33.5% produced a statistically significant positive result. Among winners, the 15.9% mean lift and 7.5% median lift show why outcomes vary (2026 A/B testing benchmark). A test that produces no winner still gives you a measured result. That is useful evidence for deciding what to test next, especially when your POD store has limited traffic.
The Main Types of Split Tests You Can Run
Not every experiment needs the same structure. A product page headline and a complete storefront redesign shouldn't consume the same amount of traffic, setup effort, or analysis time.
A/B testing is the natural starting point. Version A is your existing asset, while version B changes one element. You might compare one hero mockup against another, or one product title against a clearer alternative. Traffic is divided between the two versions, and you measure the primary outcome.
A/B/n testing adds several challengers to the control. You could compare multiple ad hooks or several offer presentations at once. This can reduce the need for sequential tests, but each version receives less traffic, which makes trustworthy conclusions harder when your store is small.
Multivariate testing changes multiple elements and evaluates combinations. For example, you might test two headlines alongside two mockups and two calls to action. That creates many possible combinations, so this approach belongs on a high-traffic bestseller page with a mature testing process, not on a new listing with occasional visitors.
Split URL testing sends shoppers to entirely different page URLs. It suits a radical redesign, a new checkout flow, or a major layout experiment where changing one front-end element isn't enough.
| Test Type | How It Works | Traffic Needed | Best POD Use Case |
|---|---|---|---|
| A/B | Compares a control with one variation | Lowest of these formats | Headline, mockup, CTA, or product description |
| A/B/n | Compares a control with multiple challengers | More than a basic A/B test | Several ad creatives or offer presentations |
| Multivariate | Tests combinations of multiple elements | High traffic | Refining a proven bestseller page |
| Split URL | Routes visitors to separate page versions | Moderate to high, depending on complexity | Radical redesign or different buying flow |
For most POD operators, A/B testing is the right default. It keeps the question narrow and makes the result easier to act on. A/B/n can make sense once you have enough traffic to support several versions. Multivariate testing should wait until your store has a strong bestseller and reliable measurement. Split URL testing is useful when the change is structural rather than cosmetic.
If you want another perspective on applying experiments across retail journeys, Reddog Consulting Group's A/B testing guide is a helpful reference.
The Statistical Basics You Actually Need
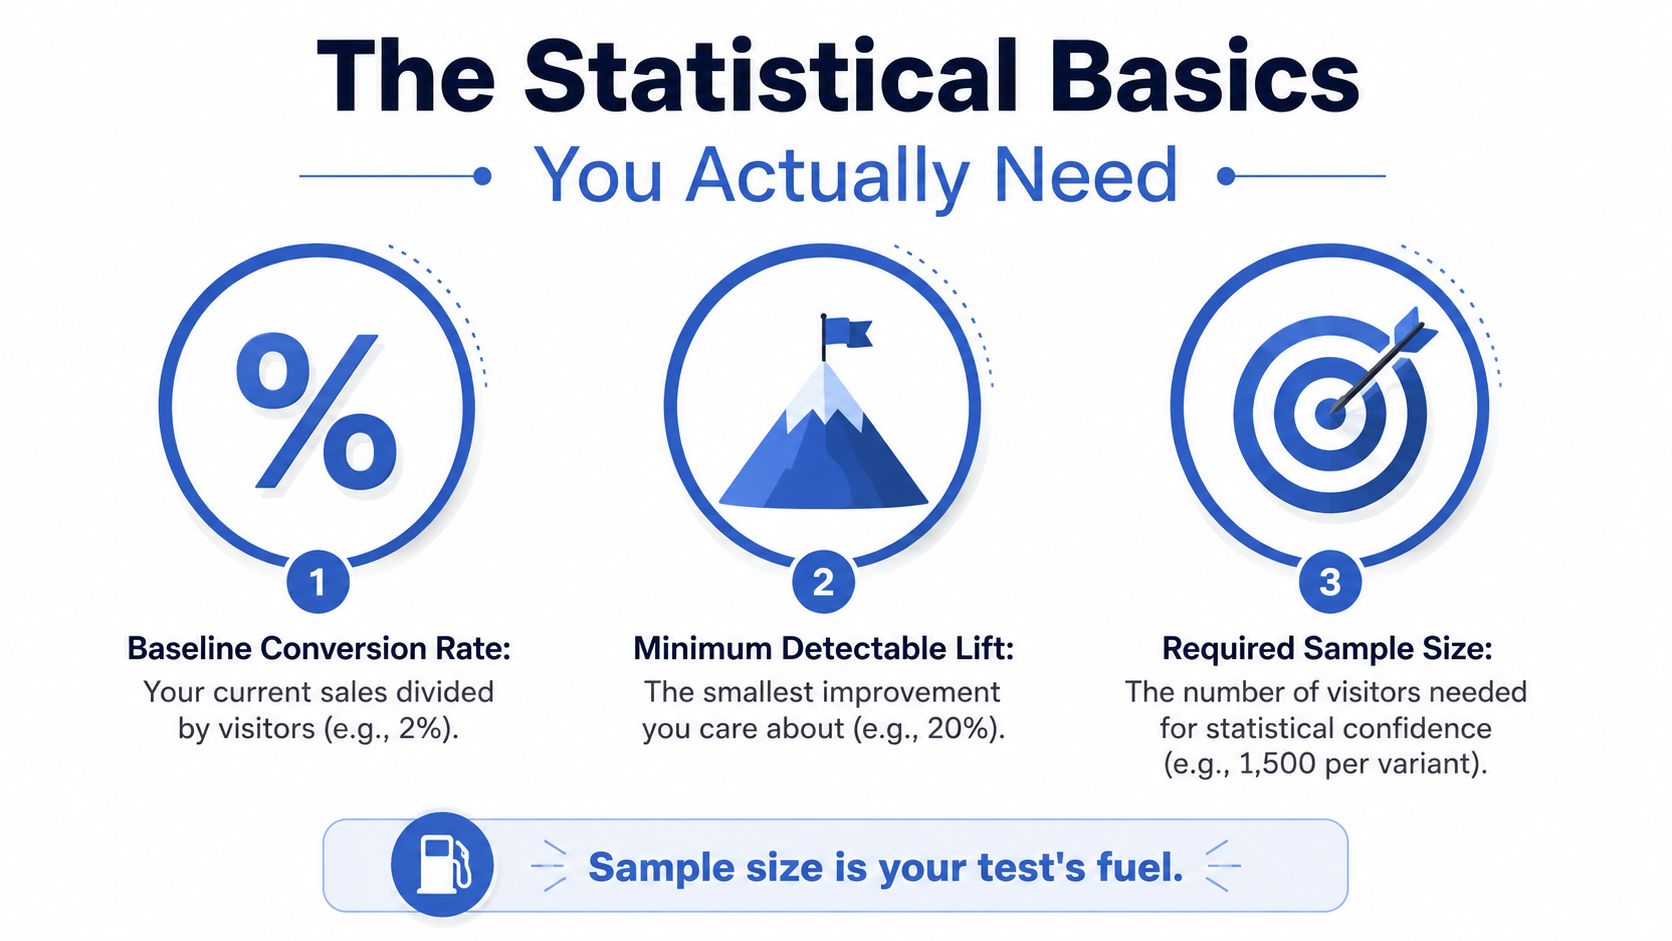
You don't need to become a statistician to run a responsible split test. You do need to understand three planning inputs: baseline conversion rate, minimum detectable lift, and required sample size.
Your baseline conversion rate is the current percentage of visitors who complete the action you care about. If your product page normally turns visitors into buyers at a low rate, that baseline tells you how much evidence you'll need. A low baseline usually means you need more visitors before a difference becomes clear.
Your minimum detectable lift is the smallest improvement worth pursuing. If a tiny change wouldn't affect your profit or operating decisions, don't design a test around detecting it. Choose an effect that would matter economically, then plan around that threshold.
Sample size is the fuel
Required sample size means the number of visitors each variation needs before you treat the result as dependable. It doesn't mean the number of visitors needed before one version happens to look ahead. Early fluctuations can be noise.
A common planning convention uses 95% statistical significance, which is often explained as the result being unlikely to come from random variation under the same testing conditions. Statistical power describes the chance of detecting a real improvement when one exists. Underpowered tests often end with “no clear difference,” even when one version performs better.
A practical planning sequence looks like this:
- Record your baseline. Use the same conversion event you'll use in the test.
- Choose the smallest worthwhile lift. Make it meaningful for your store, not merely attractive on a dashboard.
- Estimate the required visitors per variation. Use a reputable sample-size calculator before launch.
- Split traffic evenly when possible. A near 50/50 allocation usually minimizes the variance between groups, while heavily skewed allocations can require more total users for similar power (traffic allocation guidance).
- Set the stopping rule in advance. Don't change it because one variation looks exciting halfway through.
For context, an eCommerce benchmark places average conversion rates around 2.5% to 3%, with typical test lifts around 15% to 25% (eCommerce A/B testing benchmarks). Treat those figures as market context, not a promise for your store. Your own baseline, traffic quality, product demand, and offer will determine the result.
You can deepen your measurement foundation with this guide to analytics for eCommerce, especially before choosing which store action should serve as your primary metric.
A Reusable Setup Template for POD Sellers
A good test begins before you open your testing software. Write the decision down first. That small habit keeps the experiment from drifting into a collection of last-minute edits.
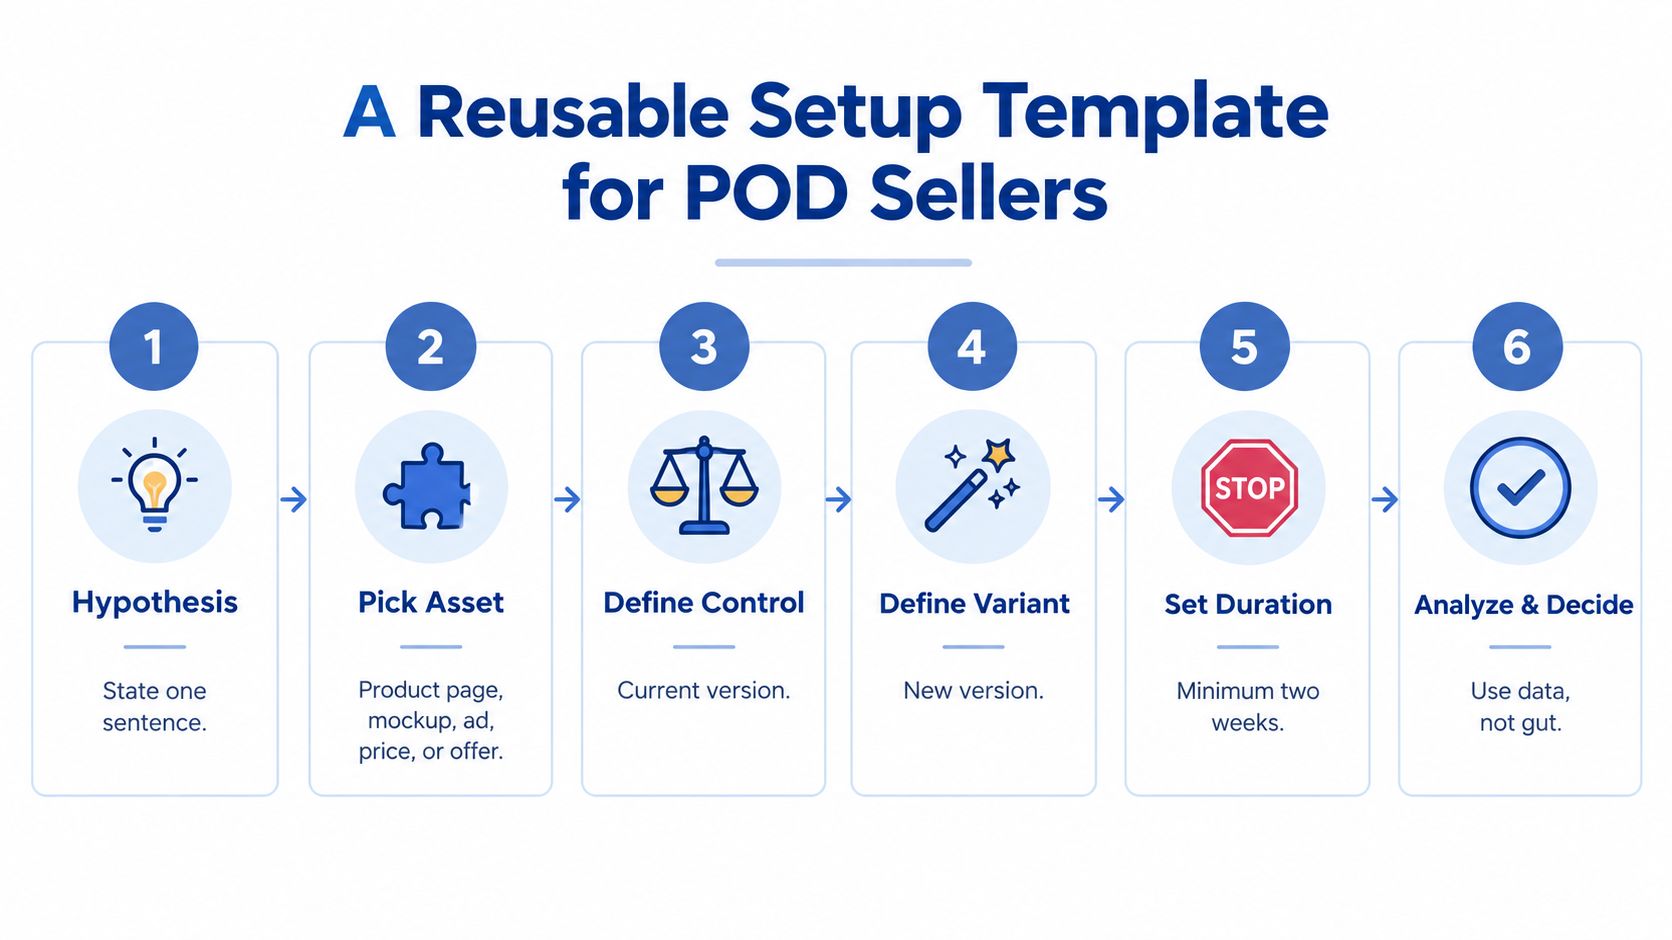
Six decisions to make before launch
1. State one hypothesis. Use a sentence with a clear cause and outcome: “Showing a lifestyle hero mockup will increase completed purchases because shoppers can better picture the shirt in use.”
2. Pick the asset. Choose a product page, mockup, ad creative, price, description, or offer. The asset should connect directly to the shopper action you want to improve.
3. Define the control. This is the version shoppers see today. Save the exact copy, image, price, and settings so you can identify what changed.
4. Define the variant. Make one visible change tied to the hypothesis. If you're testing a mockup, don't also rewrite the headline. If you're testing price, keep the page experience otherwise consistent.
5. Choose the primary metric and guardrail. The primary metric might be purchases or revenue per visitor. A guardrail could include add-to-cart rate, checkout completion, refund behavior, or another measure that helps you avoid celebrating a misleading click increase.
6. Calculate the sample and schedule. Use your baseline conversion rate and minimum detectable effect to estimate the visitors required. Run across complete weeks where possible so weekday and weekend behavior don't dominate the result. The provided setup visual uses a minimum duration of two weeks as a planning example, but your traffic and sample-size requirements should determine the actual schedule.
Apply the template to real POD decisions
For a price test, you might compare $19.99 with $24.99, provided both prices fit your margin and positioning strategy. The primary metric shouldn't be clicks alone. Revenue per visitor can reveal whether the higher price produces enough value per shopper to offset any decline in orders.
An offer test could compare a 10% bundle discount with free shipping over $50. Keep the products, traffic sources, and page structure stable. Track the purchase outcome and a profitability guardrail, because an offer that increases order volume but weakens contribution margin may not be the right long-term choice.
For a mockup test, replace only the first image and leave the gallery order, copy, price, and CTA unchanged. This is the kind of focused experiment that suits a growing POD store.
You can find more practical guidance in Skup's step-by-step guide to testing print-on-demand designs. Tools such as AvatarIQ can also help you produce alternative apparel mockups efficiently, giving you more testable creative options without promoting a full redesign workflow.
Before you launch: one question, one meaningful change, one primary metric, and one decision rule.
Common Pitfalls That Quietly Ruin Results
A test can look polished and still produce an unreliable answer. The most common problems happen after launch, when early results tempt you to interfere.
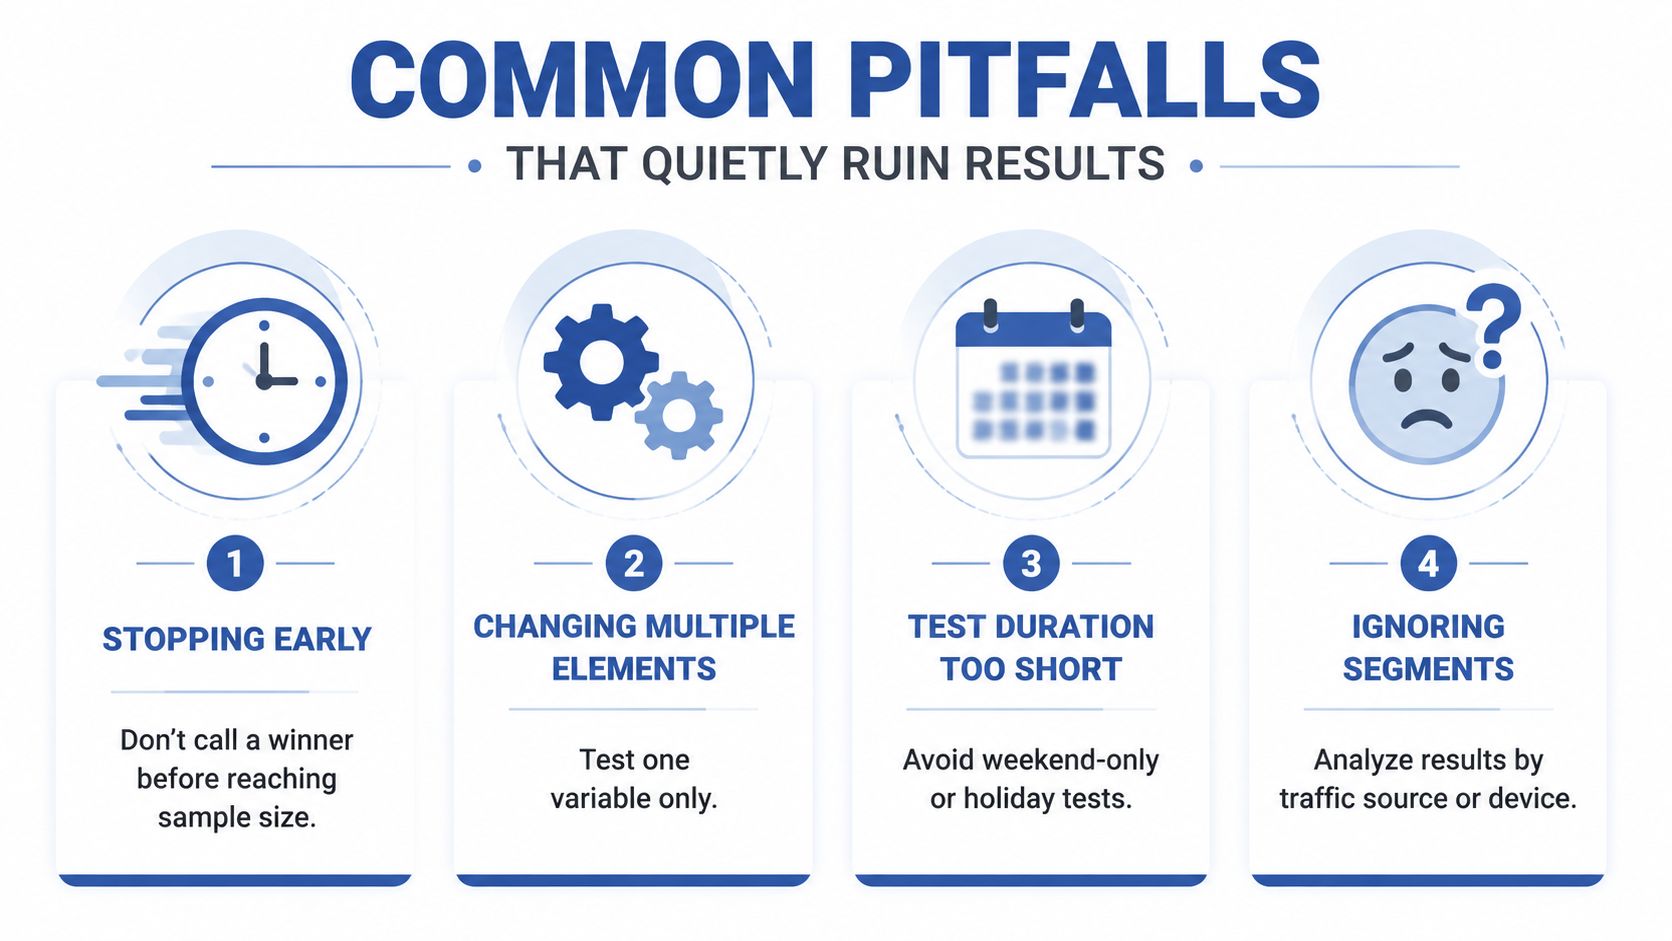
The first trap is stopping as soon as one version leads. Random variation can create an early advantage that disappears as more visitors arrive. Preset the required sample and duration, then review the final result only after that requirement is met.
The second is changing several elements together. A new mockup, rewritten headline, and altered CTA may outperform the control, but you won't know which change earned the result. If the page performs worse, you also won't know what to restore.
Protect the experiment from outside noise
A holiday, flash sale, influencer mention, or major ad-budget change can alter shopper intent. If the control runs during one type of demand and the variation runs during another, the comparison no longer answers your original question. Keep promotions and traffic conditions as consistent as possible.
Segmentation matters, too. Mobile visitors may respond differently from desktop shoppers, while new visitors may behave differently from returning customers. Don't automatically declare a universal winner if the overall result hides a meaningful difference between devices or traffic sources.
A practical mistake is treating a tiny result as conclusive. The Ascend2 research lists limited traffic as the top challenge for 51% of respondents, followed by lack of resources at 47% and the time-consuming nature of execution at 38% (Ascend2 A/B testing research). Those constraints are normal for small stores, so label low-volume findings as exploratory rather than forcing certainty.
Use this quick protection list:
- Early stopping: Follow the sample-size rule you set before launch.
- Multiple changes: Isolate one variable whenever the test format allows it.
- Short windows: Avoid drawing conclusions from a weekend-only or holiday-only run.
- Segment gaps: Review device, source, and audience differences before implementation.
Premature stopping, sample-ratio mismatch, cross-contamination, and short-term lifts that fade over time are all recognized experimentation risks (common A/B testing challenges). You're not expected to avoid every mistake forever. You are expected to build a process that catches them earlier.
High-Impact Test Ideas Worth Running First
Your first POD test should answer a focused question about a decision shoppers already face. With limited traffic, choose changes that are easy to isolate and close to the purchase.
Start with high-clarity page tests
A hero mockup swap is a practical starting point. The product presentation appears immediately, and the hypothesis is easy to state: a clearer mockup will increase purchase intent. Measure the buying action, such as completed purchases or revenue per visitor, rather than treating image clicks as the result.
The value proposition above the fold is another strong candidate. Replace vague wording with a direct explanation of the design, garment, audience, or offer. Keep the layout stable so the comparison shows whether the message changed behavior.
A single primary CTA may also reduce competing choices. Compare a focused “Shop now” path with a page that gives several actions equal prominence. Judge the outcome by completed purchases or revenue per visitor, not by clicks alone.
| Tier | Test Idea | Traffic Needed | Expected Impact |
|---|---|---|---|
| Tier one | Hero mockup, value proposition, or primary CTA | Lower than complex page tests | Clearer buying path and potentially meaningful improvement |
| Tier two | Price, bundle offer, product page depth, or social proof placement | Moderate | Better value perception or stronger purchase confidence |
| Tier three | Ad hooks, creatives, audiences, or placements | Higher and more segmented | Better traffic quality and campaign efficiency |
Tier two tests need closer attention because they can change both conversion behavior and profit. Compare price points within a sensible range, a bundle with a single product, or different review placements. Set the win condition around the financial outcome that matters, not engagement alone.
Use tier three for paid campaign analysis. Test ad hooks or creative angles, then inspect results by audience and placement. An ad can attract clicks that perform poorly on the product page, so connect campaign results with store results before scaling. General conversion rate optimization tips for online stores can help you identify offer and friction questions worth testing, although POD buying journeys still require store-specific judgment.
Recent benchmarks show why small gains deserve attention. One 2026 summary found 60% of completed A/B tests delivered under 20% lift, while 84% came in under 50% (2026 split-testing benchmarks). For a low-traffic POD store, a modest, profitable improvement is often more useful than a dramatic result that cannot be repeated.
Choose one Tier one test this week. Record the hypothesis, change one clear element, and let the result define the next question.
Your Valid Test Checklist and What Comes Next
Before sending traffic into an experiment, run a final validation check. If you can't explain the test in a few sentences, it probably contains too many moving parts.
- Clear hypothesis: You can state what changes and why.
- Primary metric: You know the exact shopper action that decides the result.
- Guardrail metric: You'll notice if the apparent win damages another important outcome.
- Pre-calculated sample: You've planned around your baseline and minimum worthwhile effect.
- Fixed duration: You won't end the test because an early chart looks exciting.
- Single variable: The control and variant differ in the way your hypothesis describes.
- Random allocation: Visitors have a fair chance of seeing each version.
- Stable conditions: Promotions, major campaigns, and sitewide changes won't distort the comparison.
- End-of-test review: You'll analyze the result after the agreed stopping point.
A valid test doesn't need to produce a winner every time. In the 2026 benchmark cited earlier, only 36.3% of e-commerce A/B tests produced a statistically significant winner, while winning tests showed a 2.77% median revenue-per-visitor uplift and a 1.88% median conversion-rate uplift (eCommerce test benchmark). Those results point to the key opportunity: split testing is built to find small, economically useful improvements, not dramatic breakthroughs on demand.
The most encouraging part is what happens after an inconclusive test. You learn that the idea wasn't strong enough under those conditions, the effect may be smaller than your store can detect, or the page may not be the right place to focus. That knowledge improves your next hypothesis and keeps you from rebuilding the store around a guess.
Start with one quick-win test from the priority matrix. Record the setup and outcome, update your baseline, and queue the next question. With a steady rhythm, your POD store becomes easier to understand, easier to improve, and more exciting to grow because every decision teaches you something useful.
Use Skup to build your POD foundation with practical education, while AvatarIQ supports faster apparel design and mockup creation for future experiments. Choose one product page variable this week, prepare your control and variant, and turn the next batch of shopper traffic into a clear learning opportunity.