Home » Blog » Build an Ecommerce Profit Calculator to Unlock Your True Margins
An ecommerce profit calculator is a tool that forces you to look beyond the vanity metric of revenue and stare your real numbers in the face. It pulls in all the sneaky, hidden expenses—shipping, ad spend, transaction fees, you name it—to show you what you're actually banking. Most store owners I talk to are shocked when they see their true margins for the first time. It's an absolutely essential gut check for any brand that wants to stick around.
Why Most Stores Are Flying Blind On Profitability
It’s a story I’ve heard a thousand times. The Shopify dashboard shows a healthy six-figure month, and you think you’re crushing it. But when you check the bank account, the math just doesn't add up. Where did all the money go?
This gap between what you think you're making and what's actually hitting your account is a brand killer. The culprit is almost always an oversimplified view of profit: Revenue – Cost of Product. That formula is a trap. It completely ignores the dozens of "silent killers" that bleed your business dry, one transaction at a time.
The Hidden Costs Draining Your Bank Account
Real profitability lives in the details. Sure, you're tracking your Cost of Goods Sold (COGS), but what about all the little fees that pile up with every single order? These are the profit leaks that a good ecommerce profit calculator brings into the light.
Some of the usual suspects that get missed are:
Payment Processing Fees: That 2.9% + 30¢ from Shopify Payments or Stripe feels like pocket change on a single order. Over a year, it can easily add up to thousands of dollars you never accounted for.
Return Handling Costs: A return is so much more than just lost revenue. You’re eating shipping costs (often both ways), paying for labor to inspect and restock the item, and sometimes dealing with a damaged product you can't even resell. It's a huge profit drain.
Software and App Subscriptions: That monthly bill for your email platform, review app, and shipping software isn't just a business expense—it's an operational cost that needs to be factored into the profitability of each order.
Packaging Materials: Those beautiful custom boxes, branded tape, and thank-you inserts? They create a killer unboxing experience, but they also add a very real cost to every single package that leaves your warehouse.
When you ignore these numbers, you're operating with a false sense of security. You’re "revenue rich and profit poor." You're busy shipping orders but might be just breaking even—or worse, losing money on every sale.
Gross Profit vs. Net Profit: The Only Difference That Matters
If you want to get a real handle on your finances, you have to know the difference between two critical numbers. Gross Profit is simply your revenue minus the direct cost of the products you sold (COGS). It shows you how much cash you have left over to pay for everything else.
But Net Profit? That’s the whole story. It’s what’s left after you subtract everything—COGS, marketing, shipping, transaction fees, salaries, software, taxes, the whole nine yards. This is your take-home profit, the number that actually determines if you can grow, hire, and build a sustainable business.
A business can have a killer gross profit margin and still be completely unprofitable if its operating expenses are out of control. Only looking at revenue is like driving a car by staring at the speedometer while completely ignoring the fuel gauge.
In the world of ecommerce, knowing your margins is everything. A healthy net profit margin for an ecommerce business typically falls somewhere between 10% and 20%. But you can't know where you stand without a detailed, honest-to-goodness calculator.
Here’s a quick rundown of the metrics we'll be digging into.
Key Profit Metrics At a Glance
This table breaks down the essential metrics you'll be calculating. Think of it as your financial dashboard cheat sheet.
Metric
What It Measures
Why It Matters
Gross Profit
Revenue – Cost of Goods Sold (COGS).
Shows the basic profitability of your products before overhead.
Contribution Margin
Revenue – All Variable Costs per Sale.
Reveals how much profit each sale contributes to covering fixed costs.
Net Profit
Gross Profit – All Operating Expenses.
The bottom line. This is the actual cash your business generates.
Blended CPA
Total Ad Spend / Total New Customers.
Your true, all-in cost to acquire a single new customer across all channels.
LTV:CAC Ratio
Customer Lifetime Value / Customer Acquisition Cost.
The ultimate health metric. It tells you if you're spending profitably to grow.
Getting a crystal-clear view of these numbers is the first step toward making smarter decisions. As the old saying goes, what gets measured gets managed, and that’s never been more true than with your store's finances. This guide will walk you through building a tool that takes you from guessing to knowing, setting you up for real, sustainable growth.
Gathering Every Cost for an Accurate Calculation
An ecommerce profit calculator is only as smart as the numbers you feed it. Garbage in, garbage out, as they say.
If you're only tracking your Cost of Goods Sold (COGS), you're flying blind with a dangerously incomplete picture of your store's financial health. Real, bankable profit is found by digging deeper into every single expense tied to selling your products.
Let’s go beyond the basics and build out a full checklist of the variable costs you absolutely have to track. This process will turn a simple estimator into a legit diagnostic tool for your business.
Uncovering Your True Shipping and Fulfillment Expenses
Shipping is way more than just the postage on the label. It's a surprisingly complex expense that a ton of store owners get wrong, and it’s a massive source of profit leaks. To nail this number down, you need to account for everything involved in getting an order from your warehouse to a customer's front door.
Start by pulling together these inputs:
Carrier Fees: This is the obvious one—what you pay USPS, FedEx, or DHL for the actual delivery service.
Packaging Materials: Don't gloss over the cost of boxes, poly mailers, tape, filler, and any custom inserts or thank-you notes. These little things add up fast.
Fulfillment Labor: If you have staff picking and packing orders, their time is a direct cost. Figure out an average cost per order based on their wages and how many packages they can get out the door per hour.
3PL Fees: Using a third-party logistics provider? You need to include all their charges, like pick-and-pack fees, storage fees, and any account management costs.
To truly get the full financial picture, you have to understand how to calculate landed cost for ecommerce profit. This concept wraps up every single expense up to the point of final delivery, making sure no shipping-related cost gets left behind.
Calculating Your Real Advertising and Marketing Costs
Your cost per sale isn't just what you're spending on Meta or Google ads. Your true Customer Acquisition Cost (CAC) includes every single dollar you spent to get that customer to finally click "buy." This is easily one of the largest and most underestimated expenses for any ecommerce brand.
A detailed profit calculator has to factor in:
Ad Platform Spend: The direct cost you pay to platforms like Facebook, Instagram, TikTok, and Google.
Creative Production: This is the hidden cost everyone misses. Did you pay a freelancer for ad creative? The cost of AI-powered tools like AvatarIQ that help you pump out high-converting ad visuals has to be amortized across your sales.
Influencer and Affiliate Payouts: Any commissions or flat fees you pay to partners for driving sales for you.
Marketing Team Costs: A slice of the salaries for your marketing staff or the monthly retainer for your agency.
Your profit calculator will reveal some harsh truths, especially around ad costs. CAC often eats up 20-30% of revenue in competitive markets. Imagine a $30 product cost, $10 shipping, 5% platform fees, and a $15 CAC per sale. A basic calculation shows your true profit per unit nosedives to just $5-10 after a 10% return rate. You'd be lucky to hit a 15% margin.
Accounting for Every Other Hidden Expense
Once you've locked down your biggest variable costs—COGS, shipping, and ads—it's time to hunt down the smaller, often-ignored expenses that quietly chip away at your margins. This is death by a thousand cuts, and it's how a "profitable" product actually becomes a loser.
Make sure your ecommerce profit calculator includes these:
Platform & Transaction Fees: Whether you're on Shopify or BigCommerce, you're paying a monthly fee and usually a percentage per transaction.
Payment Gateway Fees: Services like Stripe, PayPal, or Shopify Payments typically skim around 2.9% + $0.30 off every single transaction. It’s a non-negotiable cost of doing business online.
Discount Codes: Every coupon you offer is a direct hit to your revenue and profit. You have to track the total value of all discounts redeemed.
Returns Processing: The cost of returns goes way beyond just the lost revenue. You have return shipping labels, labor for inspecting and restocking items, and potentially damaged products you can't even resell.
Customer Service: Factor in the cost of your support team's time or your helpdesk software subscriptions, attributing a tiny piece of that cost to each order.
Pulling these numbers together might feel like a chore, but it's a critical step toward real financial clarity. Once you have this complete list, you can build a calculator that reflects reality, not just wishful thinking. For those in specific niches, understanding what constitutes a good profit margin is crucial, as these hidden costs can have an even bigger impact.
How To Build Your Profit Calculator Spreadsheet
Theory is one thing, but now it's time to roll up your sleeves and actually build the tool that gives you true financial clarity. We're moving from just gathering numbers to plugging them into a practical, powerful spreadsheet. This isn't about filling in a template; it's about understanding the engine that drives your store's profitability.
Building your own ecommerce profit calculator from the ground up gives you total control to track what really matters for your specific business. You'll want to structure it to analyze profitability on three critical levels: per-product, per-order, and on a monthly basis. This multi-layered view is what separates the pros from the amateurs.
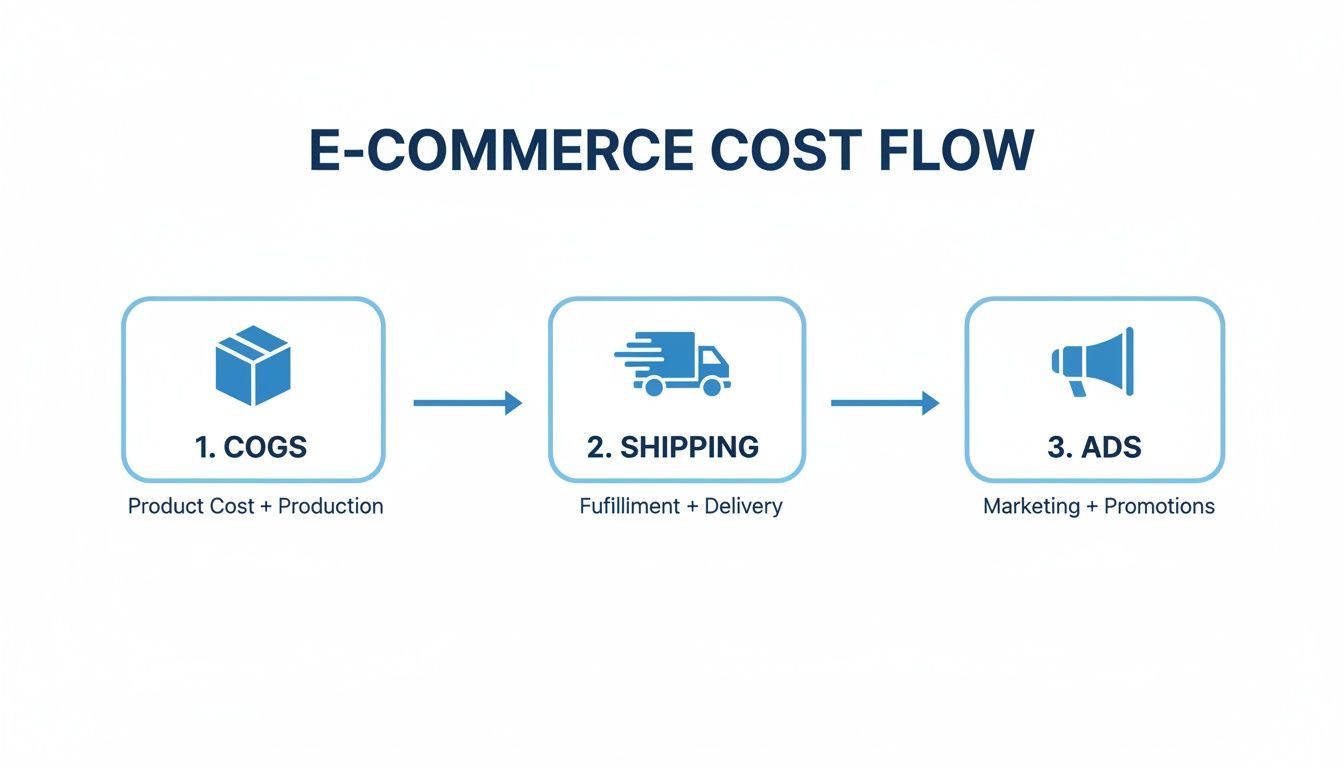
This flow chart breaks down the fundamental journey of costs in a typical ecommerce sale. It all starts with the product itself (COGS), moves through shipping, and finally accounts for the ad spend needed to get the customer in the door.
Each of these stages represents a major variable cost that your calculator has to track accurately. Get this right, and you'll uncover your true profit margin.
Structuring Your Profitability Spreadsheet
Look, the best calculators are clean and easy to read. A messy spreadsheet is just as useless as having no spreadsheet at all. Let's set up a logical structure you can actually use and build on.
I recommend creating three main tabs or sections in your sheet:
Inputs & Variables: Think of this as your control center. It's where you'll list all the costs that can change, like product COGS, average shipping fees, transaction percentages, and your ad spend. Keeping these variables in one place makes updating your entire calculator a breeze.
Per-Order Calculator: This section is designed to pull from your Inputs tab to calculate the profitability of a single, typical order. This is where you see the immediate financial impact of each customer checking out.
Monthly P&L (Profit & Loss): This tab gives you the 30,000-foot view. It rolls up all your per-order data and adds in your fixed monthly costs (like Shopify fees or app subscriptions) to show your final net profit over time.
This segmented approach keeps your data organized. It lets you zoom in on a specific product's margin or zoom out for a high-level checkup on your business's health.
The Essential Formulas You Need
At the heart of any good profit calculator are a few core formulas. These are what turn your raw data into actionable insights, showing you exactly where every dollar is going.
Below is a quick-reference guide to the core formulas you’ll need. Getting these into your spreadsheet is the first step to truly understanding your store's financial health.
Essential Formulas for Your Profit Calculator
Formula Name
Calculation
Purpose
Gross Profit
Retail Price - Cost of Goods Sold (COGS)
The most basic measure of product-level profitability.
Contribution Margin
Retail Price - All Variable Costs
Shows how much profit each sale contributes toward covering your fixed costs.
Net Profit
Total Contribution Margin - All Fixed Costs
The final "bottom line"—the actual cash your business keeps after all expenses.
Mastering these calculations will tell you a story. Gross Profit tells you if your product is priced correctly. Contribution Margin tells you if each sale is actually helping your business grow. And Net Profit tells you if you're really making any money.
By 2025, knowing these numbers inside and out will be non-negotiable for staying afloat. While the average ecom profit margin often lands between 10-30%, a well-run store can absolutely hit 20-40%, depending on its niche and business model.
Worked Example: Print-On-Demand Store
Let's make this real. Here's an example for a Print-On-Demand (POD) apparel store, which has a unique cost structure since there are no upfront inventory costs. You only pay for the product after you make a sale.
Let's say you sell a t-shirt for $35.00.
Item
Cost
Notes
T-Shirt Cost (COGS)
-$12.50
This is what your POD supplier charges you.
Shipping Cost
-$5.50
Paid to the POD supplier for fulfillment.
Transaction Fee (3%)
-$1.05
Standard payment gateway fee.
Contribution Margin
$15.95
Profit per sale before ad costs.
Ad Spend (CAC)
-$10.00
Your average cost to acquire one customer.
Net Profit Per Sale
$5.95
Your actual take-home profit.
In this scenario, you've got a healthy $15.95 contribution margin. That's the money you have left over to pay for advertising and other business expenses. After factoring in a $10.00 Customer Acquisition Cost (CAC), your true net profit on that t-shirt is $5.95. Not bad.
Worked Example: Inventory-Based Brand
Now let's switch gears and look at a more traditional inventory-based brand, like one selling custom-branded water bottles. Here, COGS is paid for upfront before you ever sell a single unit.
You sell a water bottle for $28.00.
Item
Cost
Notes
Landed Product Cost (COGS)
-$7.00
The per-unit cost including manufacturing and freight.
Fulfillment & Shipping
-$6.00
Your 3PL and postage costs.
Transaction Fee (3%)
-$0.84
Payment gateway fee.
Contribution Margin
$14.16
Profit per sale before ad costs.
Ad Spend (CAC)
-$12.00
You have a higher CAC in this competitive niche.
Net Profit Per Sale
$2.16
Your final profit on this order.
Here, the net profit is a much slimmer $2.16 per unit, mostly because of a higher CAC. This is an immediate red flag. It signals that you either need to slash your acquisition costs or find creative ways to boost your Average Order Value (AOV) to make each transaction more profitable.
As you build out your own calculator, you might find that you need more specialized tools to dive deeper into advertising efficiency. A dedicated Return on Ad Spend Calculator can give you the granular insights needed to really optimize your ad performance.
Using Your Calculator to Find Hidden Profit Leaks
Okay, you've built your calculator and plugged in your real numbers. This is where it goes from being a simple spreadsheet to a powerful diagnostic tool for your business. Its real magic isn't just spitting out a final profit number; it's showing you why that number is what it is. You're moving past basic accounting and into strategic analysis, hunting down the quiet leaks draining your bank account.
Think of the calculator as a financial MRI for your store. It lets you see beneath surface-level metrics like revenue and pinpoint the exact spots where your margins are getting crushed. By running different scenarios and tweaking the numbers, you can start asking much smarter questions and, more importantly, get actionable answers.
Diagnosing Common Profitability Problems
Once you get your data in, patterns will start to jump out at you. These patterns are usually symptoms of deeper issues in your operations, marketing, or pricing strategy. Learning to read these signals is the key to turning that analysis into actual, money-making action.
Here are a few classic scenarios I see all the time and what they probably mean:
High Gross Profit, Low Net Profit: This is a dead giveaway that your product margins are solid, but your operational and marketing costs are bleeding you dry. The main suspect here is almost always your Customer Acquisition Cost (CAC). You're likely spending way too much to get customers in the door, either through aggressive ad spend or by using channels that just aren't converting profitably.
Low Contribution Margin: If this number is weak, it means each individual sale isn't generating enough cash to cover your fixed business costs. The problem is baked into your variable costs per order. You need to take a hard look at your shipping rates, payment processing fees, and product costs to see where you can negotiate better deals or find efficiencies.
Negative Profit on Certain Products: When you break things down to the SKU level, you'll often find that some products are profit machines while others are literally costing you money on every sale. This is super common with low-priced items where fixed costs for shipping and fulfillment completely wipe out the margin.
Your calculator’s job is to make the invisible visible. A high return rate, for instance, isn't just a line item. It's a compounding problem that doubles your shipping costs, adds labor expenses for restocking, and can destroy the profitability of an entire product line if left unchecked.
Pinpointing Specific Margin Killers
Your calculator is the perfect tool for playing "what if." By isolating one variable at a time, you can see its precise impact on your bottom line. This is how you go from having vague concerns to identifying specific, data-backed problems you can actually fix.
Start your investigation by focusing on these high-impact areas:
Unprofitable Ad Campaigns Stop looking at your overall blended CAC. You need to dig into the campaign-specific data. It's not unusual to find that your top-of-funnel TikTok campaign has a CAC of $45, while your Google Shopping campaign is bringing in customers for just $15. Your calculator will show you, in stark black and white, that scaling the wrong campaign could bankrupt you, even if it's driving a ton of sales.
Excessive Shipping Costs Pull a report of your shipping costs by region. You'll probably find that shipping to certain states or countries is dramatically more expensive. If you offer flat-rate or free shipping, every order going to those high-cost areas could be a significant loss leader. Use the calculator to model the financial impact of setting up zoned shipping rates or adding regional surcharges.
Overly Generous Discount Codes Discounts feel like an easy lever to pull for more sales, but they can be a silent margin killer. Run the numbers on a best-selling product with and without your most popular coupon code. That 20% off might feel harmless, but you might discover it's turning a profitable order into a break-even transaction once you factor in ad costs.
Ultimately, this diagnostic process turns your ecommerce profit calculator from a passive reporting tool into an active strategic weapon. It’s not just for looking back at what happened last month; it’s for modeling the future and making informed decisions that will directly boost your bottom line.
Actionable Strategies to Boost Your Profit Margins
Alright, you've used the profit calculator and pinpointed where the money is leaking out. That's the first step. Now for the fun part: plugging those leaks and turning that data into more cash in your pocket.
This isn't about guesswork. We're talking about making specific, surgical changes to your business and watching the numbers on your calculator tick up. These strategies are designed to fix the issues you've found and proactively grow your margins, tying every action back to a metric you can actually measure.
Smarter Pricing and AOV Enhancement
Your pricing is never set in stone. One of the fastest ways to juice your profitability is simply getting more value from every single transaction. This isn't just about cranking up prices across the board; it’s about strategically increasing your Average Order Value (AOV), making each customer you acquire that much more profitable.
Product bundling is a classic for a reason—it works. Instead of selling just one t-shirt, why not bundle it with a matching hat and socks for a slight discount? You move more inventory, your AOV shoots up, and suddenly your shipping costs per item look a lot better.
Think about it this way: the advertising cost to acquire a customer is the same whether they buy one $30 shirt or a $70 bundle. By encouraging a larger cart size, you dramatically improve the contribution margin on that single, hard-won transaction.
Driving Down Acquisition Costs with CRO
Your Customer Acquisition Cost (CAC) is easily one of the biggest drains on your net profit. Conversion Rate Optimization (CRO) is your best weapon for fighting back. CRO is all about making small, smart tweaks to your website that convince more visitors to buy, which directly lowers the cost of landing each new customer.
Start with your product pages. Are your descriptions compelling? Are your images sharp and your calls-to-action impossible to miss? For apparel brands, using a tool like AvatarIQ can be a game-changer. It lets you create stunning, AI-generated mockups that make your products look incredibly professional without the hefty price tag of a full-blown photoshoot. A better-looking product page converts more traffic, period.
Next, attack your checkout process. Every single field a customer has to fill out is another chance for them to get distracted and bail. Removing that friction can give you a serious lift in your conversion rate, making every ad dollar you spend work that much harder.
Ad Optimization for Profit, Not Just Revenue
Too many brands get caught up chasing vanity metrics like clicks or even total revenue from their ad campaigns. Your ecommerce profit calculator gives you the clarity to focus on what actually matters: profitable ad spend. This means having the guts to turn off campaigns that are driving sales at a loss, even if they look good on the surface.
Funnel your budget into the channels and audiences that deliver the highest Return on Ad Spend (ROAS). If your calculator shows that your Google Shopping ads bring in customers for $15 while your Instagram ads cost you $40 a pop, it’s a no-brainer where that money should go.
This profit-first mindset also applies to your products. Our Apparel Cloning course, for example, teaches you how to create unique, high-margin products that stand out from the crowd. When you're selling something nobody else has, you aren't stuck competing on price alone, which gives you more breathing room to absorb ad costs and maintain healthy margins.
And don't forget that a strong brand with loyal customers is your ultimate cheat code. Check out these powerful customer retention strategies for ecommerce to learn how to keep your best buyers coming back for more.
Making Your Profit Calculator Work in the Real World
Even with the slickest calculator template, running an ecommerce business means dealing with moving targets. Once you start plugging in your real-world numbers, you'll inevitably hit a few practical snags.
Getting these details right is the difference between having a powerful tool that guides your decisions and just another spreadsheet that gathers digital dust. Let's walk through some of the most common questions that pop up when you put your profit calculator to work.
How Should I Handle Fluctuating Costs Like Ad Spend?
This one comes up all the time. Your ad spend and Customer Acquisition Cost (CAC) can swing wildly, especially during a big sale or peak season. So, what number do you actually put in the box?
The trick is to use a rolling average. Don't just grab today's CAC. Instead, pull the average from the last 14 or 30 days. This smooths out the daily spikes and dips from a campaign that's having a great day or a terrible one, giving you a much more stable and realistic figure to base your decisions on. For bigger-picture planning, I'll even look at a 90-day average to see the broader trends.
How Often Should I Update My Calculator?
An outdated calculator is a useless one. Your numbers are constantly changing, and your tool needs to keep up if you want it to be a reliable source of truth for your store's financial health.
As a bare minimum, you need to do a full update at least once per month. But honestly, certain events should trigger an immediate refresh:
Supplier Price Changes: The second you get an email from your supplier about a price hike (or drop), that number needs to go into your calculator.
New Shipping Rates: Carriers love to update their rates. When they do, your sheet needs to reflect that reality.
Launching a New Ad Channel: Firing up a new platform like TikTok or Pinterest? It will have its own unique CAC that needs to be factored into the mix immediately.
Think of your calculator as a living document, not something you set and forget. A monthly check-in is the absolute baseline. You want the insights you're pulling to be based on what's happening now, not last quarter.
Can I Use This Data to Project Future Profitability?
Absolutely. This is where your calculator goes from a simple reporting tool to a strategic weapon. Once you have a solid baseline of your current numbers, you can start running "what-if" scenarios to see what the future might hold.
This is how you get ahead. Start asking questions and plugging in the numbers to see what happens:
"What happens to my net profit if my ad costs jump by 15% next quarter?"
"How much would my margin improve if I managed to negotiate a 10% discount on my packaging?"
"If I launch a new product bundle that bumps my AOV by $20, what does that actually do for my bottom line this month?"
By modeling these potential changes, you stop guessing and start making data-driven decisions. You can set realistic growth targets and turn your simple calculator into a core part of your strategic planning.
At Skup, we're all about building profitable businesses from day one. Our tools and training are built by people who have actually run 8-figure ecommerce stores and know what it takes. Ready to get the clarity you need to scale? Check out our programs at https://skup.net.
You've probably hit this point already. Your store is working, your ads are producing sales, email is doing its job, and you know the offer is solid. But every new sale still feels tied to something you have to manage directly, whether that's ad spend, creative testing, or campaign cleanup. That's where a smart affiliate…
You're probably sitting on a messy list right now. A few niche ideas feel exciting. A few seem profitable. A few sound safe because other people are already doing them. Then your brain starts doing what most beginners do. It tries to avoid making the wrong choice, so it makes no choice at all. That's…
A lot of people land on eBay at the same moment in life. Bills feel tighter than they should. The job pays the rent but not much more. You want a real way into eCommerce, but you don't want to bet the farm on your first try. That's why eBay still matters. It gives beginners…