Home » Blog » How to Calculate Break Even ROAS for Profitability
Stop guessing with your ad spend. It's time to start engineering profit.
The absolute simplest way to figure out your break even ROAS is with this formula: 1 ÷ Gross Profit Margin. This single number is your financial North Star—it tells you the exact point where your ad campaigns stop losing money and start making it. For any serious e-commerce brand, this is foundational.
Your Starting Point for Profitable Advertising
Every single dollar you pour into advertising needs to work for you, not against you. Understanding your break-even ROAS (Return On Ad Spend) is the first, most critical step to making sure your marketing budget builds your business instead of slowly draining your bank account.
This isn't just about avoiding losses; it's about unlocking the confidence to actually scale. Once you know your break-even point, you can make cold, hard, data-backed decisions about which campaigns to push, which ones to pause, and how aggressively you can really bid to win new customers. It completely removes the guesswork and emotion from the equation, giving you the power to build something amazing.
So, Why Is This Metric a Non-Negotiable?
For any e-commerce entrepreneur, knowing this number is your superpower. It lets you operate with precision, ensuring every product you launch and every ad you run has a clear, defined path to profitability. Without it, you're flying blind, hoping for the best. With it, you're in complete control.
Think about the sheer scale of online retail for a second. With e-commerce spending hitting a staggering $1.1 trillion in 2023, the opportunity is massive. If your gross profit margin is 40%, your break-even ROAS is 1 / 0.4 = 2.5. That means you need to generate $2.50 in revenue for every $1.00 you spend on ads just to cover your costs.
Historically, many brands failed to do this simple math, leading to them burning cash on campaigns that looked good on the surface but were actually unprofitable. To dig a bit deeper into the core concept, you can learn more about the break-even point formula from HighRadius.
This guide is built to cut through all the noise and give you a repeatable system for building a profit engine.
Key Takeaway: Your break-even ROAS isn't just another metric to track. It's the baseline that defines success, paving the way for profitable scaling and long-term brand growth.
Before we dive into the calculations, you'll need to pull together a few key pieces of financial data from your business. Having these numbers ready will make the process a whole lot smoother.
Core Components for Your Break-Even ROAS Calculation
Component
What It Means for Your Business
Where to Find This Information
Revenue
The total amount of money generated from sales.
Your e-commerce platform dashboard (e.g., Shopify Analytics) or accounting software.
Cost of Goods Sold (COGS)
The direct costs of producing the products you sell (materials, manufacturing, etc.).
Your supplier invoices, inventory management system, or accounting software.
Ad Spend
The total amount of money spent on advertising campaigns.
Additional costs that change with sales volume (e.g., transaction fees, shipping).
Your payment processor statements (e.g., Stripe, PayPal) and shipping carrier reports.
Fixed Costs (Optional)
Consistent, recurring costs that don't change with sales (e.g., software subscriptions, rent).
Your accounting software or bank statements.
Gathering this information is your first real step. With these components in hand, you’re ready to take control of your numbers and start building a truly resilient, high-margin business with confidence.
Let's Nail Down Your Break-Even ROAS Formula
Alright, let's get into the weeds and master the calculation that separates the brands that scale from the ones that stall. The best part? It's deceptively simple. The core formula is straightforward, but it unlocks a level of clarity that will completely change how you manage your ad spend.
Here's the fundamental formula you need to burn into your brain:
Break-Even ROAS = 1 / Gross Profit Margin
That’s it. One simple division tells you the exact ROAS you need to hit to cover the direct costs of the product you just sold through an ad.
First, Find Your Gross Profit Margin
Before you can use the formula, you have to know your Gross Profit Margin. This is just the percentage of revenue you pocket after paying for the product itself, or your Cost of Goods Sold (COGS). Don't worry, this is also a simple two-step process.
First, figure out your Gross Profit in dollars:
Gross Profit = Product Selling Price – Cost of Goods Sold (COGS)
By calculating this, you're isolating the profit from each individual sale before factoring in things like rent, salaries, or other overhead. This is the engine of your business, and understanding it is non-negotiable if you're serious about building a profitable brand.
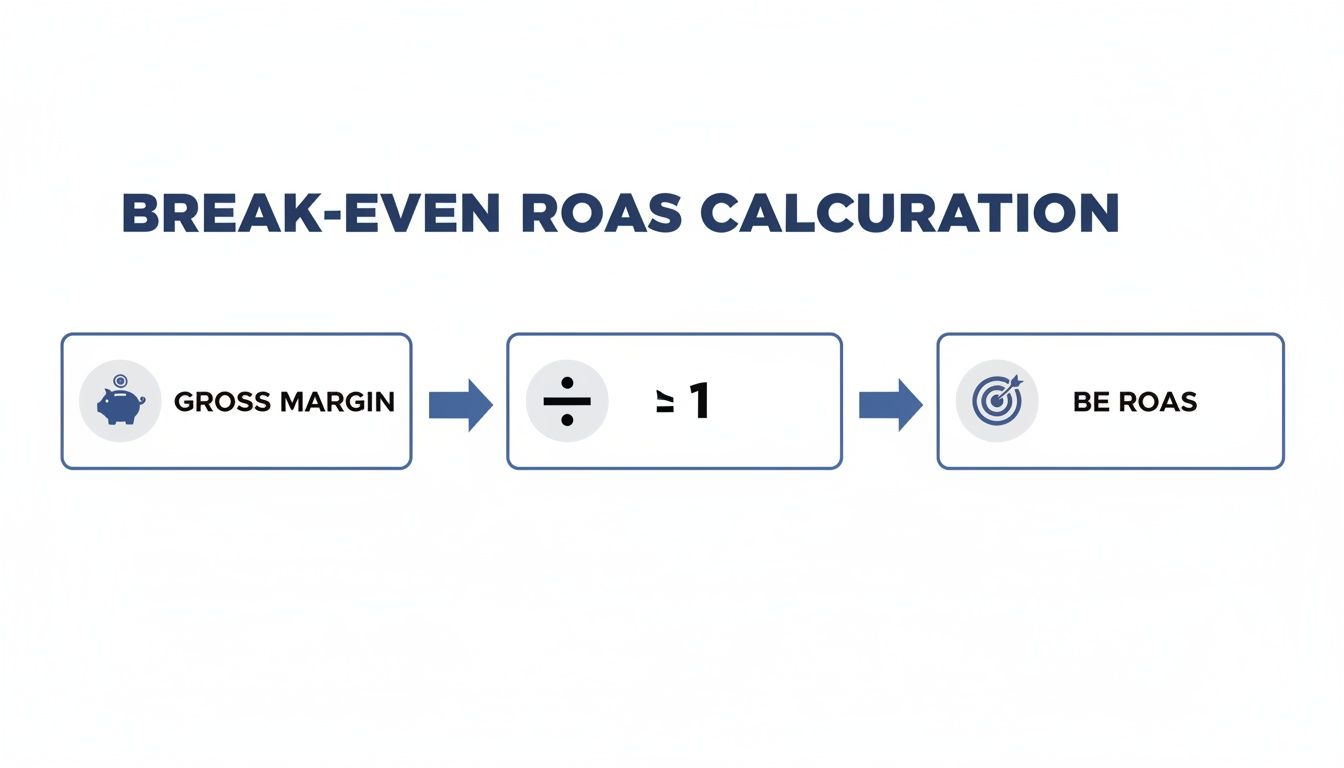
This flowchart breaks down how your gross margin is the essential first step to finding your break-even ROAS.
As you can see, it all hinges on that gross margin number. Once you have it, you're just one step away from your target.
A Quick Print-On-Demand Example
Let's make this real with a classic print-on-demand (POD) t-shirt. I love using POD for examples because the numbers are so clean and direct, making it a fantastic and accessible entry point for new store owners.
Imagine you're selling a premium t-shirt on your Shopify store.
Selling Price: You charge the customer $30.
Cost of Goods Sold (COGS): Your POD partner charges you $15 for the blank shirt, printing, and fulfillment.
First, let's find the gross profit from this one sale:
Simple enough. You made $15 in gross profit. Now, let's find the margin:
$15 (Gross Profit) / $30 (Selling Price) = 0.50
Your gross profit margin is 50%. Now you have the only number you need to find your break-even ROAS. Let's plug it into the main formula:
Break-Even ROAS = 1 / 0.50 = 2.0
This is your magic number. A break-even ROAS of 2.0 means you must generate $2 in revenue for every $1 you spend on ads just to cover the cost of making and shipping that t-shirt. If your Meta Ads dashboard shows a ROAS of 1.9, you're officially losing money on every single sale. If it shows 2.1, you're in the green on a gross level.
Key Insight: A break-even ROAS of 2.0 turns a confusing ads manager into a simple yes/no question. Is my campaign ROAS above 2.0? If yes, great. If no, it's time to optimize.
This kind of clarity is what separates the hopeful entrepreneurs from the successful ones. It's the foundation for all profitable scaling.
Adding More Detail for Pinpoint Accuracy
The basic calculation is a game-changer, but we can dial in the accuracy even more. Your COGS shouldn't just be the product cost. It should include every variable cost directly tied to a sale.
Think about other costs that only pop up when an order comes through:
Payment Processing Fees: Stripe and Shopify Payments usually take around 2.9% + $0.30 per transaction.
Shipping Costs: If you absorb some shipping costs or offer deals, your actual expense might be higher than what the customer paid.
Transaction Fees: Some platforms (like Shopify) have a small per-sale fee depending on your plan.
Let’s add a payment processing fee to our t-shirt example. On a $30 sale, that fee would be about $1.17 ($30 * 0.029 + $0.30).
Now, our total variable costs (a more accurate COGS) look like this:
Finally, let's recalculate our break-even ROAS with this better number:
Break-Even ROAS = 1 / 0.461 = 2.17
Just by including that small processing fee, our break-even point jumped from 2.0 to 2.17. It might not seem like a huge difference, but at scale, it's everything. If you were running ads at a 2.1 ROAS thinking you were profitable, you could actually be burning thousands of dollars a month without realizing it.
For a deeper dive into all the numbers that impact your true profitability, our comprehensive ecommerce profit calculator is a fantastic resource.
With this framework, you can now confidently calculate the break-even ROAS for any product you sell. You have the exact formula to move from guessing to knowing, putting you in complete control of your brand's financial destiny.
Applying Your Calculation with Real Examples
Theory is great, but seeing the numbers in action is where the rubber really meets the road. Once you get past the formula and start plugging in your own costs, everything just clicks. This is the moment you stop just running ads and start strategically engineering your store's profit.
Let's walk through three different ecommerce scenarios to make this formula tangible. Each one gives you a clear framework you can swipe for your own business, no matter what you're selling.
Example 1: The Print-On-Demand Hoodie
Print-on-demand is a fantastic business model because it's so asset-light, allowing anyone to get started with an incredible idea. The numbers are clean and super easy to track. Let's crunch the numbers for a classic POD hoodie, a staple for countless apparel brands.
Here's the cost breakdown:
Selling Price: You sell the hoodie for $55.00.
Product & Fulfillment Cost: Your POD partner bills you $25.00 for the hoodie blank, printing, and fulfillment.
Payment Processing Fee: A standard 2.9% + $0.30 fee on the selling price works out to $1.90.
Now, let's put it all together to find our break-even point.
First, we need our total variable costs—every cost tied directly to this single sale. $25.00 (Product) + $1.90 (Fee) = $26.90
Next, calculate the gross profit by subtracting those costs from the selling price. $55.00 (Price) - $26.90 (Costs) = $28.10
With that, we can find our gross profit margin. Just divide the gross profit by the selling price. $28.10 (Profit) / $55.00 (Price) = 0.51 or 51%
Finally, we calculate the Break-Even ROAS using our core formula: 1 / Gross Profit Margin. 1 / 0.51 = 1.96
For this hoodie, your break-even ROAS is 1.96. This means for every dollar you put into ads, you need to get at least $1.96 back in revenue just to cover your costs. Anything above 1.96 is gross profit you can use to pay for everything else—and yourself.
Example 2: The Physical Inventory T-Shirt Bundle
Let’s switch gears to a business that holds its own physical inventory. This model often means buying in bulk to get better unit pricing, which can seriously boost your margins. Imagine you're selling a curated 3-pack of high-quality graphic tees.
Here are the numbers for this bundle:
Selling Price: The 3-pack sells for $75.00.
Per-Unit Product Cost: You bought the tees in bulk, so each one only cost you $8.00. For a 3-pack, that's $24.00.
Shipping & Packaging: Since you're shipping it yourself, the box, filler, and postage average $6.50.
Payment Processing Fee: The 2.9% + $0.30 fee on $75.00 comes to $2.48.
Time to run the calculation with these variables.
First, your total variable costs: $24.00 (Product) + $6.50 (Shipping) + $2.48 (Fee) = $32.98
Next up, your gross profit: $75.00 (Price) - $32.98 (Costs) = $42.02
Now for the gross profit margin: $42.02 (Profit) / $75.00 (Price) = 0.56 or 56%
And finally, the break-even ROAS: 1 / 0.56 = 1.79
With a healthy 56% gross margin, your break-even ROAS drops to 1.79. The power of buying inventory is crystal clear—your target is lower, which gives you more wiggle room and a much faster path to profitability on your ad spend. This is a critical lesson for anyone trying to run truly profitable ad campaigns.
Example 3: The Digital Ebook Guide
Let's look at a model with almost zero marginal costs: a digital product. Things like guides, templates, or courses have insane profit potential because once you create them, you can sell them an infinite number of times with barely any additional cost per sale.
Let's use an ebook on a specialized topic as our example.
Selling Price: You sell your digital guide for $37.00.
Cost of Goods Sold (COGS): Essentially $0. There's no physical item to produce or ship.
Payment Processing Fee: The 2.9% + $0.30 fee on $37.00 is $1.37.
The math here is refreshingly simple.
Your only variable cost is the processing fee, which is $1.37.
So, your gross profit is: $37.00 (Price) - $1.37 (Costs) = $35.63
This gives you a massive gross profit margin: $35.63 (Profit) / $37.00 (Price) = 0.96 or 96%
And that leads to an incredibly low break-even ROAS: 1 / 0.96 = 1.04
A break-even ROAS of 1.04 is almost unheard of. It means you only need to make your ad spend back plus a tiny 4% to cover transaction fees. This is exactly why digital products can be such powerful growth engines—after breaking even, nearly every dollar of revenue is pure profit.
Break-Even ROAS Across Different Ecommerce Models
These examples show just how much the business model impacts your break-even target. A dropshipper will have a completely different ROAS goal than someone selling their own handcrafted goods. Here’s a quick comparison to illustrate the point.
Business Model
Example Selling Price
Example Total COGS
Gross Profit Margin
Calculated Break-Even ROAS
Dropshipping
$40.00
$28.00
30%
3.33
Private Label
$60.00
$24.00
60%
1.67
Digital Product
$30.00
$1.17
96%
1.04
Handmade Goods
$100.00
$45.00
55%
1.82
As you can see, higher-margin models give you much more breathing room on ad performance. Knowing where you stand is the first step toward building a scalable, profitable ad strategy.
These examples should give you a clear, repeatable process. And if you want a handy tool to simplify your calculations, check out a dedicated Return on Ad Spend calculator. No matter what you sell, you now have the framework to find your own break-even point and take complete control of your advertising profitability.
What Your ROAS Is Really Telling You
Knowing how to calculate your break-even ROAS is your ticket to the game. But learning how to interpret it? That's how you start winning.
Think of this number as more than just a formula. It’s a powerful diagnostic tool that tells you the financial health of your ad campaigns at a glance. It's the baseline that separates profitable action from expensive guesswork.
Once you have this number, you stop being a reactive advertiser and become a strategic one. You can look at your Meta Ads dashboard and know instantly if a campaign is just spinning its wheels or actually covering its own costs. This clarity is everything when it comes to scaling your brand with confidence.
Break-Even ROAS vs. Target ROAS
Let’s get one thing straight: your break-even ROAS is not your profit goal. It’s the starting line, not the finish line.
Hitting your break-even ROAS just means you’ve successfully paid for the product and the ad that sold it. That's it. You haven't made a dime.
Your Target ROAS is the real prize. This is the ROAS you need to hit to not only cover your direct costs but also:
Pay for your fixed costs: Think software subscriptions (like Shopify), salaries, and any other consistent monthly expenses.
Generate your desired net profit: This is the actual cash you take home or reinvest to grow the business.
So, let's say your break-even ROAS is 2.0. You might set a target ROAS of 3.5. That extra 1.5 is the gross profit that goes toward paying all your other business expenses and, you know, actually building a profitable brand.
Key Takeaway: Your break-even ROAS keeps the lights on for a specific campaign. Your target ROAS ensures the entire business thrives. Aiming only for break-even is a recipe for running a very expensive hobby.
Avoiding Common ROAS Pitfalls
As you start leaning on this metric, a few common traps can give you a false sense of security. Watch out for these—they'll keep your financial picture crystal clear and your decision-making sharp.
The most dangerous pitfall is trusting the ROAS number inside your ad platform without question. Platforms like Facebook or Google only see the initial revenue from a sale. They have zero clue about:
Refunds and Returns: If a customer returns an item, that revenue vanishes from your bank account, but it often stays right there in the ad platform's reporting.
Chargebacks: A disputed charge also claws back revenue, turning what looked like a profitable sale into a net loss.
Your Actual Profit Margins: The ad platform sees a $100 sale and happily reports $100 in revenue. It doesn't know if your profit on that sale was $60 or a measly $6.
This is exactly why your break-even point is so critical. A 2.5x ROAS on the dashboard feels great until you realize your break-even ROAS is actually 3.0x. In that scenario, you're literally losing money on every single conversion.
The data on this is stark. A 2021 study on telehealth ad campaigns showed that for some, a 1.5x ROAS was enough to break even within a year. But a separate report revealed a staggering 60% of practices that ignored their specific break-even metrics wasted a collective $2.7 million on ad spend in 2022. Understanding the specific formula—Break-even ROAS = Total Costs / Attributable Revenue Margin—is what separates growth from waste. You can dig into these findings and how they apply to profitable decisions here.
By mastering this simple calculation, you arm yourself with the knowledge to see past the vanity metrics on an ad dashboard. You'll finally understand the true financial engine of your business, setting you up for incredible, sustainable growth.
How to Improve ROAS and Surpass Your Break-Even Point
Knowing your break-even ROAS is one thing, but actually beating it is where the fun starts. This is the moment your ad spend shifts from just covering costs to actively generating profit and scaling your business. Smashing past that break-even number is your ticket to real growth, and it’s simpler than you might think.
When it comes down to it, there are really only two levers you can pull to send your ROAS through the roof: increasing your Average Order Value (AOV) and boosting your Conversion Rate. If you can nail these two, you’ll create a powerful feedback loop that fuels insane growth for your brand.
Increase Your Average Order Value
The absolute fastest way to juice your ROAS is to convince each customer to spend just a little bit more. Think about it—if a customer who clicked your ad adds just one more item to their cart, the revenue from that single ad click jumps, directly inflating your ROAS with zero extra ad spend.
This is where you get smart with your offers. A few killer tactics can encourage those bigger cart sizes:
Product Bundles: Group complementary products and offer them at a slight discount. A "Summer Grill Master Kit" with your top three sauces and a set of tongs is way more tempting than selling each item individually.
Order Bumps: Offer a small, no-brainer add-on right on the checkout page. This is the classic impulse buy—like offering a protective case for a new phone.
Post-Purchase Upsells: The moment a customer completes a purchase, hit them with a one-time-only offer for a related item. Their wallet is already out, making this a prime opportunity.
These aren't just theories; they're incredibly effective. We dive deep into a ton of these tactics in our guide on boosting AOV for your Shopify store.
Key Insight: Boosting AOV is pure profit leverage. You've already paid for the customer. Every extra dollar they spend pumps up your ROAS and goes straight to your bottom line.
Elevate Your Conversion Rate
Getting more of the people who visit your site to actually pull the trigger and buy is the second critical lever. You have to remove every ounce of friction from the buying process, from the first ad they see to the final "complete purchase" click.
Your ad creative is a massive piece of this puzzle. Your images and videos need to be genuine scroll-stoppers that build instant trust and scream "you need this." This used to be a huge pain, involving expensive photoshoots, models, and endless editing cycles.
Now, tools like AvatarIQ have changed the game, letting you generate stunning, high-converting ad visuals in seconds. You can create endless variations of professional lifestyle shots and mockups without all the old-school headaches. This means you can test creatives faster, find what works, and run ads that actually connect with your audience.
Of course, the ad is just the beginning. The landing page is where the sale is won or lost. Understanding the impact of landing page relevance on ROAS is non-negotiable if you want to crush your break-even point.
Ultimately, it all comes back to having a winning product. Our apparel cloning course is a fantastic resource for creating designs people genuinely want to buy. When you combine a must-have product with killer ads and a smooth site experience, you're not just aiming to meet your break-even ROAS—you're building a system to blow right past it into profitable, scalable territory.
Got Questions About Break-Even ROAS? We've Got Answers.
As you start wrapping your head around this metric, a few questions are bound to come up. It's totally normal. Getting those questions answered is what will give you the confidence to stop guessing and start scaling your store.
Let's dive into the stuff that trips most people up when they're learning how to calculate break even roas.
What’s a Good ROAS to Aim for Above My Break-Even Point?
Ah, the golden question. The honest answer? It completely depends on your business.
You'll hear a 4:1 ROAS ($4 revenue for every $1 in ad spend) thrown around as a general benchmark for healthy growth, but that's not a rule set in stone. The only thing that matters is setting a target ROAS that actually makes you money.
Think of it this way: if your break-even ROAS is 2.5, shooting for a 4.0 ROAS gives you a 1.5 margin on every dollar you spend on ads. That's your real profit engine. That extra cushion is what pays for your software, your salary, and everything else before you can pocket the rest.
How Often Should I Recalculate My Break-Even ROAS?
Your break-even ROAS isn't a "set it and forget it" number. It's a living, breathing metric that needs to stay current.
You should get in the habit of recalculating it anytime your main costs change. This is especially true if you're in the print-on-demand space, where supplier prices can feel like they're constantly shifting.
A quarterly review is a solid baseline. But if your POD provider suddenly hikes their fulfillment fees or your shipping carrier adjusts its rates tomorrow, you need to update your numbers immediately. Flying blind with an outdated break-even point is a surefire way to make your ad targets worthless and watch your profits evaporate.
Pro Tip: Treat your break-even ROAS like a vital sign for your business. Tie its review cycle directly to any changes in your supply chain or operational costs. This keeps your ad targets grounded in reality.
Does This Calculation Cover All My Business Expenses?
Nope, and this is a hugely important distinction to make.
The standard formula—1 / Gross Profit Margin—is designed to cover your variable costs. It tells you the exact point where your ads have paid for the cost of goods and fulfillment for the product you just sold. It's an essential first step.
But it doesn't account for your fixed costs. Things like your Shopify subscription, design software, or virtual assistant fees aren't baked into that number. To cover those, you need to aim higher with a target ROAS that generates enough gross profit to pay for everything else and still leave you with a healthy net profit.
Can I Calculate a Break-Even ROAS for My Entire Ad Account?
You can, but you'll get way more mileage out of this by applying it at the product or category level.
Why? Because different products have different profit margins. It's just a fact of e-commerce. A t-shirt might have a 50% margin, while a premium hoodie sits at 55%. Those two products will have completely different break-even points.
Using a single, store-wide average can give you a vague sense of direction, but it can be really misleading if you sell a mix of high- and low-margin items. You might accidentally kill a campaign for a low-margin product that's actually performing great for its specific break-even point.
For the sharpest insights, calculate the break-even ROAS for your top-selling products first. This focused approach gives you the most accurate data to steer your ad spend and drive real, profitable growth.
Ready to create stunning ad creatives that smash past your break-even ROAS? At Skup, we build tools and training for e-commerce entrepreneurs who are serious about building profitable brands. Check out our AI-powered design tool, AvatarIQ, and see how easy it is to generate high-converting visuals that get results. Learn more at Skup.net.
Imagine launching a full-blown apparel brand without ever touching a single t-shirt or hoodie. That’s the magic of print on demand, and if you’ve been waiting for the right moment to jump in, this is it. This is your complete roadmap to getting your first sale and building a real, high-margin brand from the ground…
Quick Answer Matt Schmitt is the co-founder of Skup, a print-on-demand ecommerce training company. With over $30 million in personal ecommerce sales and a decade of experience building and scaling POD stores, Matt oversees Skup’s coaching program and teaches the systems that helped him exit multiple 7-figure businesses. His students have collectively generated tens of…
Ready to turn your creativity into cash? The fastest way to make money selling t-shirts is to find designs that are already crushing it, create even better versions with your own unique spin, and sell them to passionate audiences. The exciting world of print-on-demand allows you to start with virtually zero risk and build a…